ATAC-seq Fragment Length Distribution: What the Nucleosome Ladder Is Telling You
How to read the ATAC-seq fragment length histogram, what a good library looks like, the three failure patterns, and what the NFR fraction actually measures.
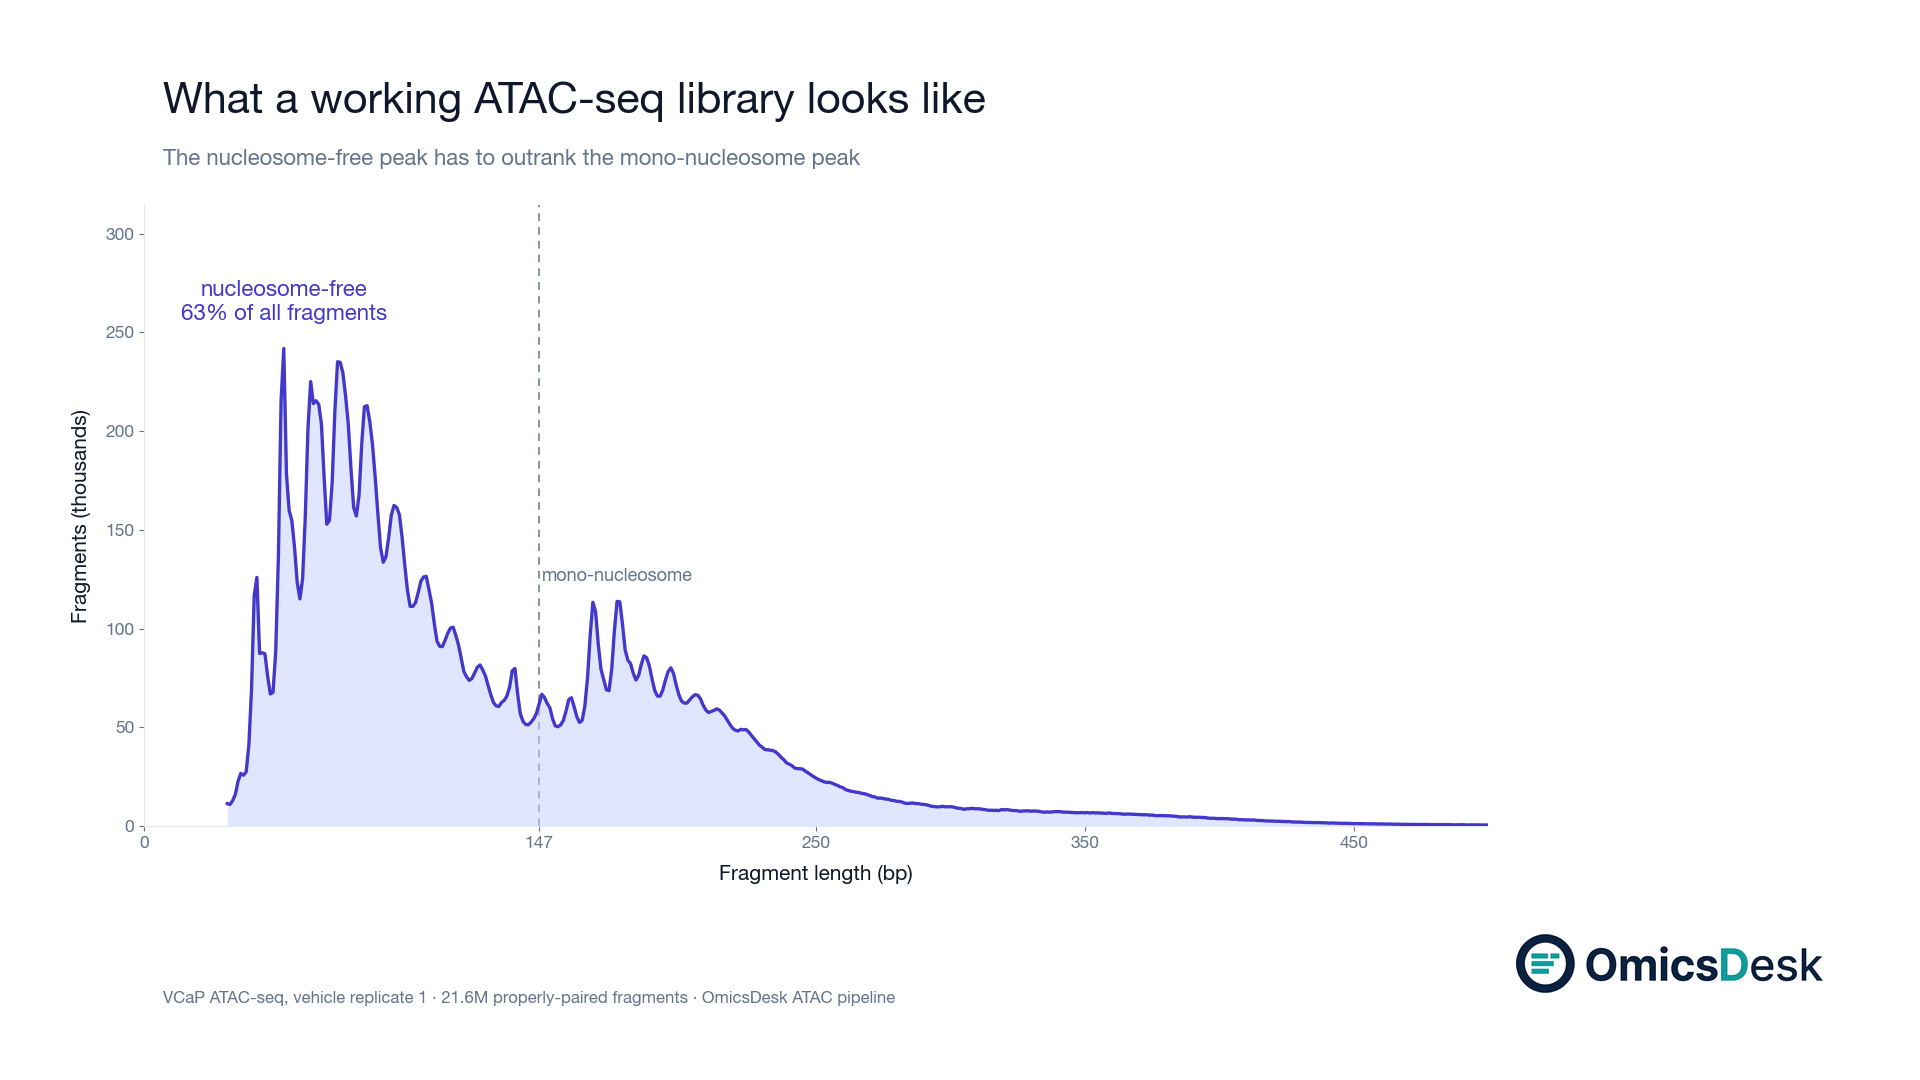
Before you call a single peak or run a differential accessibility analysis, look at the fragment length histogram. It is the fastest, most informative single plot in the entire ATAC-seq QC workflow. It will tell you whether the chromatin was in the right state when Tn5 was added, and it will catch problems that no amount of downstream analysis can fix.
Why ATAC-seq produces a ladder
In ATAC-seq, a hyperactive Tn5 transposase is added to intact nuclei. Tn5 inserts its transposons preferentially into accessible chromatin, the regions not wrapped around nucleosomes. When you sequence the resulting fragments, the length of each fragment reflects exactly where in the chromatin landscape the two cuts landed.
If both cuts landed in the same nucleosome-free region (NFR), the fragment is short: roughly 100 to 200bp. If one cut was on each side of a single nucleosome (a mono-nucleosomal fragment), you get a longer fragment: roughly 150bp of linker plus 147bp of nucleosomal DNA, coming out to around 200bp total, though in practice the distribution centers around 200bp with a shoulder. Di-nucleosomal fragments span two nucleosomes and their linkers: around 400bp. Tri-nucleosomal: around 600bp.
The result is a characteristic staircase pattern: peaks at approximately 150bp, 200bp, 400bp, and 600bp, each shorter and smaller than the previous. The interval between the mono, di, and tri-nucleosomal peaks is approximately the nucleosome repeat length (about 200bp in mammalian chromatin), and that regularity is itself a quality signal.
One caveat before you go looking for all four: in a library that was size-selected during prep, or sequenced with a short insert cutoff, the di- and tri-nucleosomal peaks often flatten into a smooth decaying tail rather than resolving as distinct humps. The hero figure above is exactly that case, and it is a good library. The absence of a visible tri-nucleosomal peak is not a failure. The absence of the NFR peak is.
There is also a finer periodicity worth noticing. The oscillation visible inside the NFR peak, with a period of roughly 10 to 11bp, is the helical pitch of DNA: Tn5 cuts preferentially where the minor groove faces away from the histone surface or the underlying protein. Seeing that ripple is a sign the transposition was clean.
What a good library looks like: the NFR criterion
The single most useful rule: the NFR peak (the peak under 200bp) must be taller than the mono-nucleosomal peak.
This is the ENCODE ATAC-seq standard. When the NFR peak is the tallest in the distribution, it means Tn5 preferentially cut where the chromatin was open, which is the whole point of the assay. The ratio NFR reads to mono-nucleosomal reads greater than 1 is the PASS threshold.
Beyond the NFR criterion, look at three things:
-
The peaks should be visible and distinct, at least for the NFR and mono-nucleosomal ones. A clean pattern means the transposition was specific and the nuclear isolation worked.
-
The NFR peak should be sharp, not broad. A broad shoulder extending into the 300bp range suggests contamination from large fragments or incomplete size selection.
-
The valley between the NFR and mono-nucleosomal peaks should be a real valley, not just a shoulder. A shallow valley indicates that a large fraction of reads are coming from intermediate-length fragments, which usually means poor chromatin compaction at the time of transposition.
Three failure patterns and what caused them
Flat distribution. No peaks, just a decreasing slope from short to long. This is over-transposition. You added too much Tn5 or incubated too long. Tn5 has cut everywhere, including closed chromatin, so the fragment length no longer reflects chromatin accessibility. The library will have high background and poor peak-to-background ratios. No computational fix can recover the signal.
Absent NFR peak. The distribution is dominated by the mono-nucleosomal peak and larger, with almost nothing under 200bp. This means Tn5 could not access the open chromatin regions. Possible causes: the nuclei were not clean (cytoplasmic debris blocking access), the chromatin was too compact (the cells were stressed or the lysis was too harsh), or the Tn5 concentration was too low. The NFR fraction in a library like this is usually under 0.2, and the FRiP score will be very low.
No ladder at all, but a broad hump. The nuclear isolation failed. You are not looking at nucleosomal chromatin; you are looking at a degraded or improperly lysed sample. The fragment lengths reflect whatever mechanical shearing occurred during lysis, not the biological chromatin structure.
How to generate the histogram
Two tools, one command each.
With deepTools, from a paired-end BAM:
bamPEFragmentSize \
  --bamfiles sample.bam \
  --histogram fragment_length.png \
  --maxFragmentLength 800
This gives you a histogram directly. Run it before you do any peak calling or filtering beyond duplicate removal.
With ATACseqQC in R:
library(ATACseqQC)
bamfile <- "sample.bam"
fragSize <- fragSizeDist(bamfile, bamfile)
ATACseqQC applies a kernel smoother and annotates the NFR, mono-, di-, and tri-nucleosomal regions. The smoothed version is easier to read when you are comparing libraries.
For a quick numerical summary without generating a plot, you can also pull the insert sizes directly from Picard:
picard CollectInsertSizeMetrics \
  I=sample.bam \
  O=insert_size_metrics.txt \
  H=insert_size_histogram.pdf
The metric you want is the fraction of pairs with insert size under 200bp.
What the histogram is really measuring
The NFR peak is not just a QC number. It is a proxy for the signal-to-noise ratio of the entire experiment.
A fragment under 200bp came from a region of accessible chromatin where Tn5 could cut. A fragment over 200bp came from a region wrapped around at least one nucleosome, meaning Tn5 had to cut on both sides of it. In an ideal ATAC library, most of your sequencing is spent on the accessible regions, not the nucleosome-bound ones.
The NFR fraction (reads under 200bp as a proportion of all reads) tells you how efficiently your sequencing budget was spent on the biology you care about. A library with NFR fraction above 0.5 will tend to produce sharper, cleaner peaks with a higher fraction of reads in peaks (FRiP). A library with NFR fraction under 0.3 will have high background and marginal peaks even at high sequencing depth.
In practice: if your NFR/mono-nuc ratio is above 1 and the fraction of sub-200bp reads is above 0.4, your library is usable and you can proceed to peak calling. If either metric is below that threshold, the fragment length histogram is telling you something went wrong upstream, and it is worth understanding what before you invest more compute time.
DM me if you want to talk through your ATAC QC. Happy to look at a histogram and give a read.
Keep reading
- 2026-08-14 How long does RNA-seq analysis take? Seven days, and the gate that ends each one Seven working days from FASTQ to interpreted report. What each day has to clear before the next one starts, what a faile…
- 2026-07-31 PCA for Batch Diagnosis: What the Plot Is Telling You and What to Do Next A practical recipe for reading PCA plots to diagnose batch effects in RNA sequencing, with the right fix depending on yo…
- 2026-07-24 ChIP-seq IDR reproducibility explained IDR (Irreproducibility Discovery Rate) tells you which ChIP-seq peaks are real across biological replicates. Here is how…