How long does RNA-seq analysis take? Seven days, and the gate that ends each one
Seven working days from FASTQ to interpreted report. What each day has to clear before the next one starts, what a failed gate costs if you find it late, and the three things that actually make a project slip.
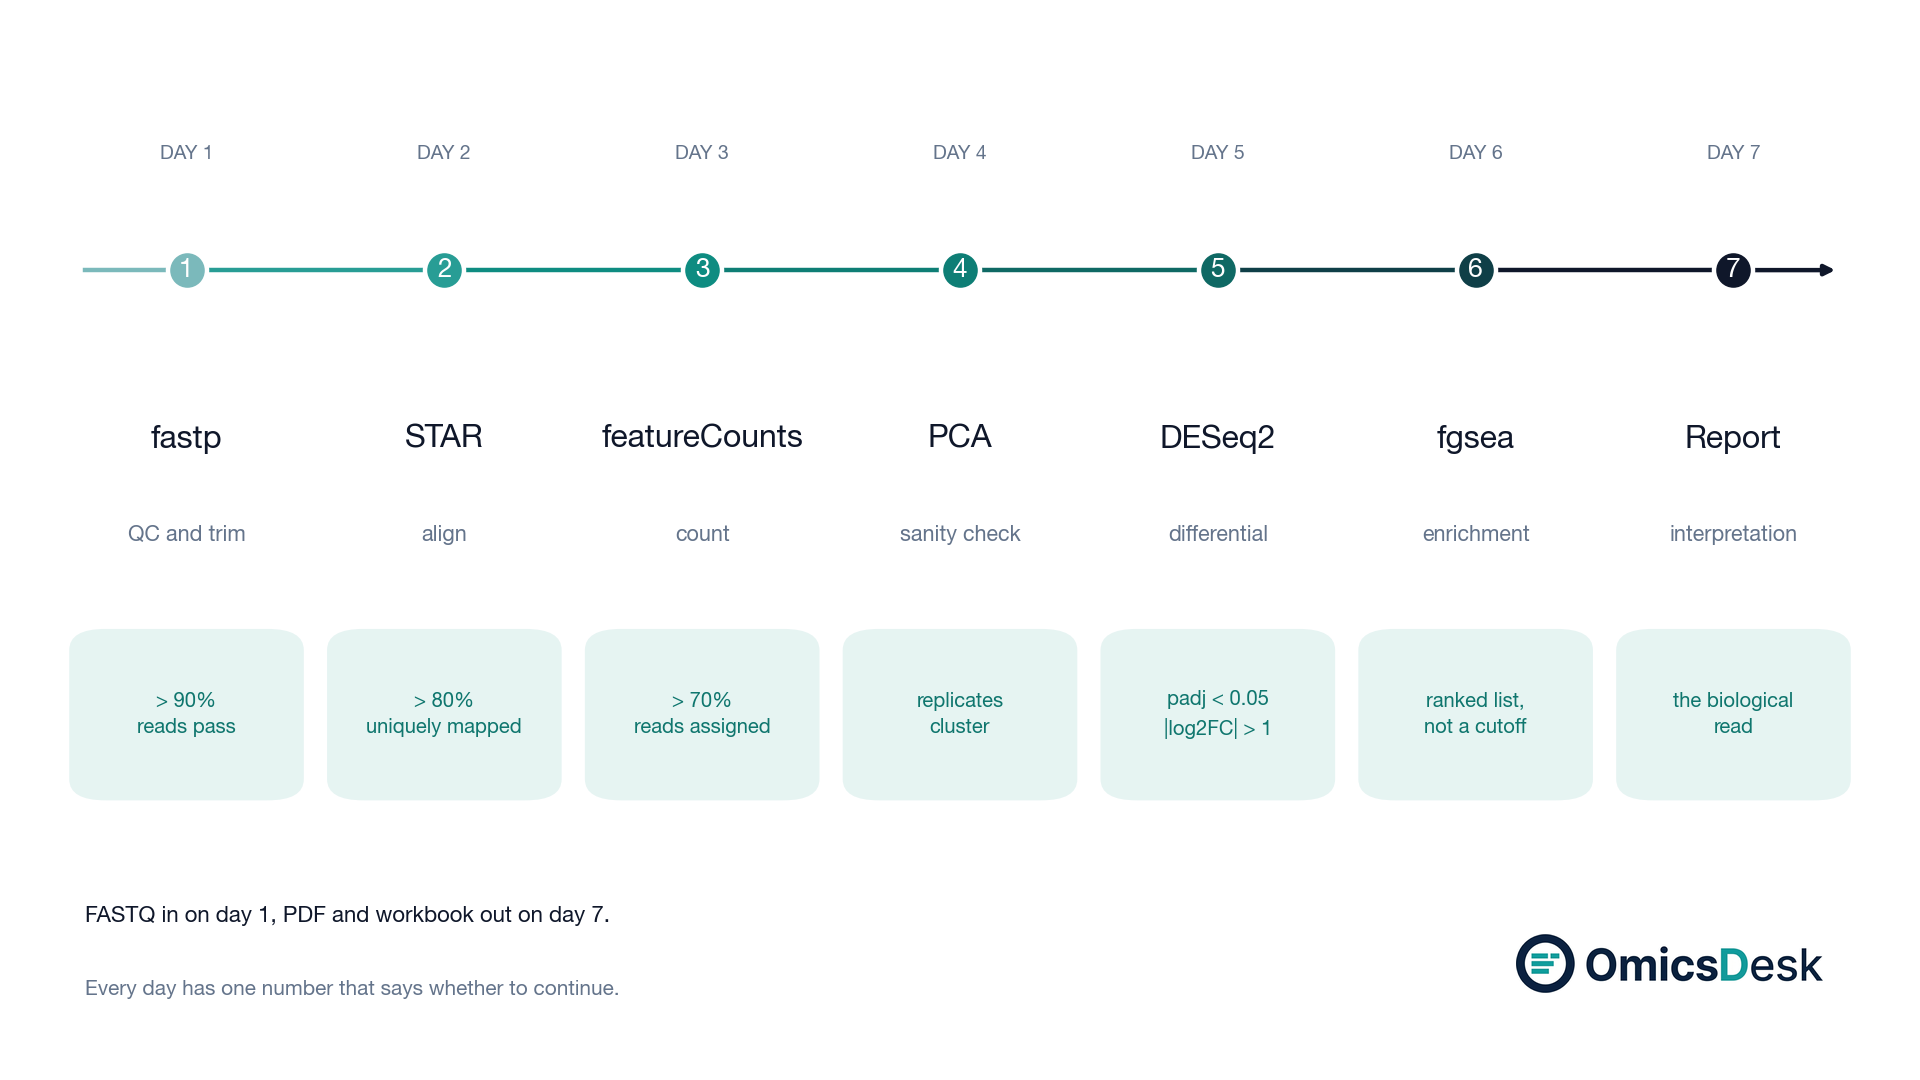
The first question a lab asks is almost never about tools. It is: how long does this take? The honest answer for a standard bulk RNA-seq comparison is seven working days.
Almost none of that is compute. The pipeline itself runs overnight. What fills the week is a sequence of seven gates: each day ends with one number or one plot that has to clear before the next day is allowed to start. That structure is the whole point, because every one of those checks is cheap on the day it belongs to and expensive later.
This is not a methods post. If you want the tool choices and the flags, that is the FASTQ to DE pipeline walkthrough. This one is about the calendar.
The seven gates
Day 1, reads. Above 90 percent of reads should survive filtering. Below 85 percent on a standard poly-A library usually means adapter dimer from a low-input prep. Cost of missing it: you align contamination for a day and wonder why the mapping rate is bad.
Day 2, alignment. Above 80 percent uniquely mapped. Below 70 percent and the usual suspects are the wrong reference build, rRNA carryover, or a degraded library. Cost of missing it: every count downstream is drawn from the wrong fraction of the library, and nothing about the DE table will look obviously wrong. (If day 2 fails for a different reason, memory, that is its own problem: the three STAR memory errors.)
Day 3, counting. Above 70 percent of aligned reads assigned to genes. A dataset where 30 percent are unassigned multi-mappers is running the statistics on 70 percent of the biology, and the missing 30 percent is not a random 30 percent. Cost of missing it: a gene family you care about is quietly absent from the results.
Day 4, sanity. Replicates cluster on PC1 and PC2, and PC1 separates conditions rather than library prep dates. This is the gate that earns the week. A batch effect found on day 4 costs one day. The same batch effect found by a reviewer costs six months. Two posts go deeper: PCA before DESeq2 and reading a PCA to diagnose a batch effect.
Day 5, statistics. padj below 0.05, with a fold-change threshold that fits the biology rather than the habit. The volcano plot is the QC of the test itself: if nothing crosses the significance line, the model is more likely misspecified than the biology silent. On picking the threshold: when |log2FC| > 1 is the wrong ruler.
Day 6, pathways. Enrichment run on the full ranked list, not on the genes that survived a cutoff. A list of 400 genes is not a result; knowing which pathways those genes are wiring together is. Background: GSEA versus over-representation.
Day 7, the read. What changed, in which direction, and what it means for the question the lab is actually asking.
Why the order is not negotiable
Days 1 to 3 are ordered by dependency, which is obvious. Day 4 is ordered by economics, which is not.
Nothing stops you from running DESeq2 on day 3 and having a gene list a day early. The reason not to is that a DE table looks equally convincing whether or not the design behind it is valid. There is no line in the output that says “your replicates did not cluster”. Once you have a list, the list becomes the thing everyone discusses, and the sanity check quietly never happens. Putting the check on its own day, before any test is run, is the only reliable way to make it happen at all.
What actually makes a project slip
Three things, in order of how often I see them.
Metadata that does not match the files. Sample names in the spreadsheet that are not the sample names in the FASTQ headers, or a condition column with two spellings of the same group. This is a half-day of email, not analysis.
An unstated batch. Samples collected in two rounds, or sequenced on two runs, mentioned for the first time on day 4 when the PCA splits them. Knowing it up front means it goes in the model. Discovering it means redoing days 4 to 6.
A design that cannot answer the question. Three conditions, two replicates each, and a question that needs an interaction term. No amount of analysis fixes this, and it is worth fifteen minutes of conversation before any sequencing happens.
None of the three is a computational problem. All three are why the honest number is seven days and not two.
Day 7 is the one you are paying for
Days 1 to 6 are reproducible. They are a Snakemake DAG, they run the same way every time, and the automation is real. Day 7 is not automatable: it is reading the result against what is known about the system, saying which part of it is the finding, and saying what to run next.
The deliverable is a 10 to 15 page report with a figure-by-figure narrative, plus an Excel workbook with the DEG table, the enrichment results and the QC metrics in separate sheets, so the lab can keep exploring after the report is delivered.
Seven days is a commitment, not an estimate. Each day has a gate, and a failed gate raises a flag instead of quietly proceeding on bad data.
DM me if you want to talk through what your dataset would look like run through this workflow, or where you think it would fail a gate.
Keep reading
- 2026-07-31 PCA for Batch Diagnosis: What the Plot Is Telling You and What to Do Next A practical recipe for reading PCA plots to diagnose batch effects in RNA sequencing, with the right fix depending on yo…
- 2026-05-29 The DESeq2 log fold change threshold: when |log2FC| > 1 is the wrong ruler The 2-fold cutoff is a cell-line habit that quietly discards real signal in clinical RNA-seq. When to lower it, why lfcS…
- 2026-05-22 RNA-seq from FASTQ to DE: what a reproducible pipeline actually looks like in 2026 End-to-end RNA-seq workflow: QC, alignment, quantification, DESeq2, pathway analysis, reporting. The five stages, the re…