ChIP-seq IDR reproducibility explained
IDR (Irreproducibility Discovery Rate) tells you which ChIP-seq peaks are real across biological replicates. Here is how to run it, what input it needs, and how to read the output.
You called 40,000 ChIP-seq peaks on replicate 1. You called 38,000 on replicate 2. The peaks look good by eye. But how many of those 40,000 are reproducible across both experiments, and how many are noise that happened to pass the q-value cutoff?
That is exactly the question IDR answers. IDR (Irreproducibility Discovery Rate) is a statistical framework for measuring which peaks are consistent across biological replicates, giving you a defensible, ENCODE-compatible reproducibility threshold before any downstream analysis.
This post is for anyone who has run MACS3 and wants to know which peaks to trust.
Why a peak count is not enough
MACS3 calls peaks by comparing enrichment in the ChIP to an input control. The q-value threshold you set determines how many peaks you get. At q < 0.05 you might get 8,000 peaks. At q < 0.99 (permissive) you might get 80,000. Neither number tells you how reproducible those peaks are across your biological replicates.
Reproducibility is not just a quality check. It is the definition of signal. A peak that shows up in one replicate at rank 100 and in the other at rank 35,000 is almost certainly noise. A peak that ranks near the top in both replicates is almost certainly real biology.
What IDR measures
IDR models the joint ranking of peaks across two replicates using a two-component mixture model (Li et al., 2011). One component describes reproducible peak pairs: their ranks are highly correlated across replicates. The other describes irreproducible noise: the ranks are uncorrelated.
Every peak pair gets an IDR score: the posterior probability that it belongs to the noise component. A score of 0.05 means there is a 5% chance this peak is irreproducible, the same logic as an FDR threshold in differential expression.
The ENCODE Consortium uses IDR < 0.05 as the reproducibility threshold for TF ChIP-seq experiments. Peaks passing this threshold in both biological replicates form the final high-confidence peak set.
The input peaks IDR needs (the most common mistake)
The most common IDR error is running it on your final strict peak set.
IDR works by comparing the ranking of many candidate peaks across two replicates. If you give it only the 8,000 peaks that passed q < 0.05, you have already thrown away the weaker-but-real peaks that would help IDR distinguish signal from noise at the boundary. The model needs a large, permissive input to do its job.
The correct approach: call peaks with a highly permissive threshold before IDR input.
# Call permissive peaks for IDR input (NOT your final analysis set)
macs3 callpeak \
  -t chip_rep1.bam -c input.bam \
  -f BAM -g hs \
  -n rep1_permissive \
  -q 0.99 \
  --nomodel --extsize 150 \
  -B --SPMR \
  --keep-dup all \
  --outdir macs3_permissive/
Run this separately for each replicate. The output narrowPeak files (sorted by signal value, column 7) become the IDR inputs.
How to run IDR in practice
Install the IDR package (available via conda or pip), then:
idr --samples rep1_permissive_peaks.narrowPeak rep2_permissive_peaks.narrowPeak \
    --input-file-type narrowPeak \
    --rank signal.value \
    --output-file chipseq_idr_output.txt \
    --idr-threshold 0.05 \
    --plot
The --rank signal.value flag tells IDR to rank peaks by the MACS3 signal value column. The --plot flag generates the rank-rank scatter, the most useful diagnostic.
The ENCODE ChIP-seq pipeline wraps this into a full workflow that also runs IDR on pseudo-replicates (pooled and split within a single replicate) to assess whether you have enough signal even before comparing true biological replicates.
How to read the output
The output file has one row per peak pair. The key column is globalIDR (column 12, or the IDR score in the header if you use the newer output format). Keep peaks where globalIDR < 0.05.
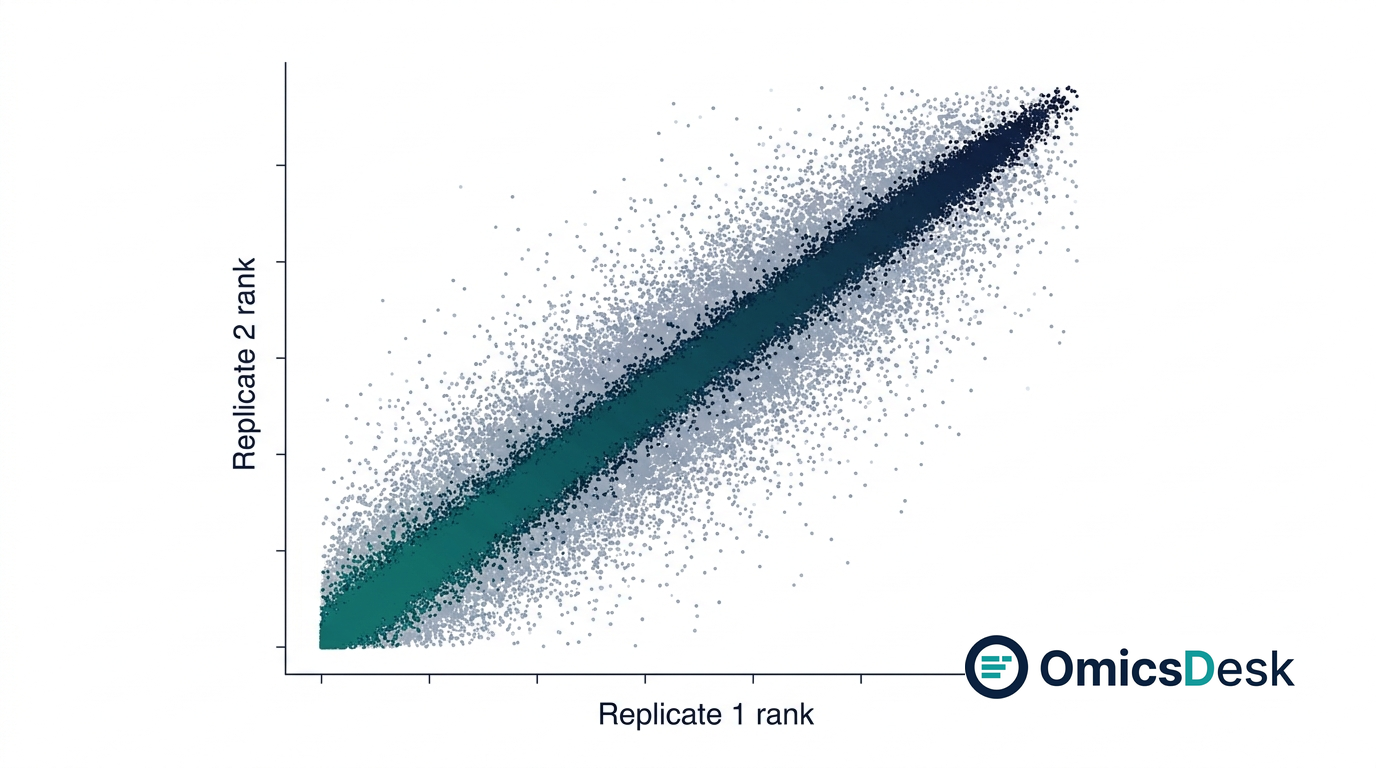
The rank-rank scatter plot is the visual truth of your experiment. The x-axis is the rank of each peak in replicate 1, the y-axis is its rank in replicate 2. A tight diagonal means the two replicates agree on which peaks are strong: the experiment worked. A diffuse cloud means they largely disagree: either the ChIP efficiency was low, the replicates are not true biological replicates, or you have a contamination problem.
The number of peaks passing IDR < 0.05 is your real peak set. It is often 20 to 40% smaller than your strict single-replicate set, and that is correct. You are removing peaks that were not reproducible.
When IDR does not apply
IDR was designed for sharp transcription factor peaks (narrow marks: CTCF, STAT3, FOXA1, H3K27ac at active promoters). The rank-rank correlation assumption holds when peaks have a clear, narrow summit.
Broad histone marks (H3K27me3, H3K4me1, H3K36me3) do not have sharp summits. Their peaks are diffuse and the ranking by signal value is noisy. For broad marks, the ENCODE pipeline uses a different QC framework (SPP’s fraction of reads in peaks, plus cross-correlation metrics) rather than IDR. DiffBind with a blocklist filter and sufficient read depth is a more appropriate route for broad-mark reproducibility.
For narrow TF or H3K27ac peaks: run IDR. For broad marks: skip IDR, use the ENCODE broad-mark guidelines.
Common mistakes
- Using strict peaks as IDR input: already covered above. Always use permissive input.
- Running IDR on fewer than 2 biological replicates: IDR requires 2 true biological replicates. Pseudo-replicates (pooled+split) are used to assess signal strength, not as a substitute for biological replication.
- Interpreting the IDR peak count as a quality gate alone: a low IDR peak count can mean excellent specificity (not many real targets) or a failed ChIP (barely any signal). Check the rank-rank scatter and the fraction of reads in peaks to tell which.
- Running IDR before removing blacklisted regions: ENCODE-curated blacklist regions (anomalous enrichment in any experiment regardless of target) should be removed from narrowPeak files before IDR. Running on unfiltered peaks inflates the noise component.
Further reading
Li, Q., Brown, J. B., Huang, H., and Bickel, P. J. (2011). Measuring reproducibility of high-throughput experiments. Annals of Applied Statistics, 5(3), 1752-1779. (The original IDR paper with the mixture model derivation.)
ENCODE ChIP-seq pipeline documentation and standards: github.com/ENCODE-DCC/chip-seq-pipeline2. The pipeline section on IDR is the authoritative reference for threshold choice and pseudo-replicate IDR.
MACS3 documentation: macs3-project.github.io. The permissive peak calling section explains the signal.value column IDR uses for ranking.
Running a ChIP-seq experiment and want to know whether your peaks are reproducible before you run enrichment analysis? That is exactly what the OmicsDesk ChIP-seq pipeline delivers: IDR-filtered peaks, annotation, and a PDF report with the rank-rank scatter and reproducibility QC built in.
DM me if you want to talk through your experiment design first.
Keep reading
- 2026-08-14 How long does RNA-seq analysis take? Seven days, and the gate that ends each one Seven working days from FASTQ to interpreted report. What each day has to clear before the next one starts, what a faile…
- 2026-08-07 ATAC-seq Fragment Length Distribution: What the Nucleosome Ladder Is Telling You How to read the ATAC-seq fragment length histogram, what a good library looks like, the three failure patterns, and what…
- 2026-07-31 PCA for Batch Diagnosis: What the Plot Is Telling You and What to Do Next A practical recipe for reading PCA plots to diagnose batch effects in RNA sequencing, with the right fix depending on yo…