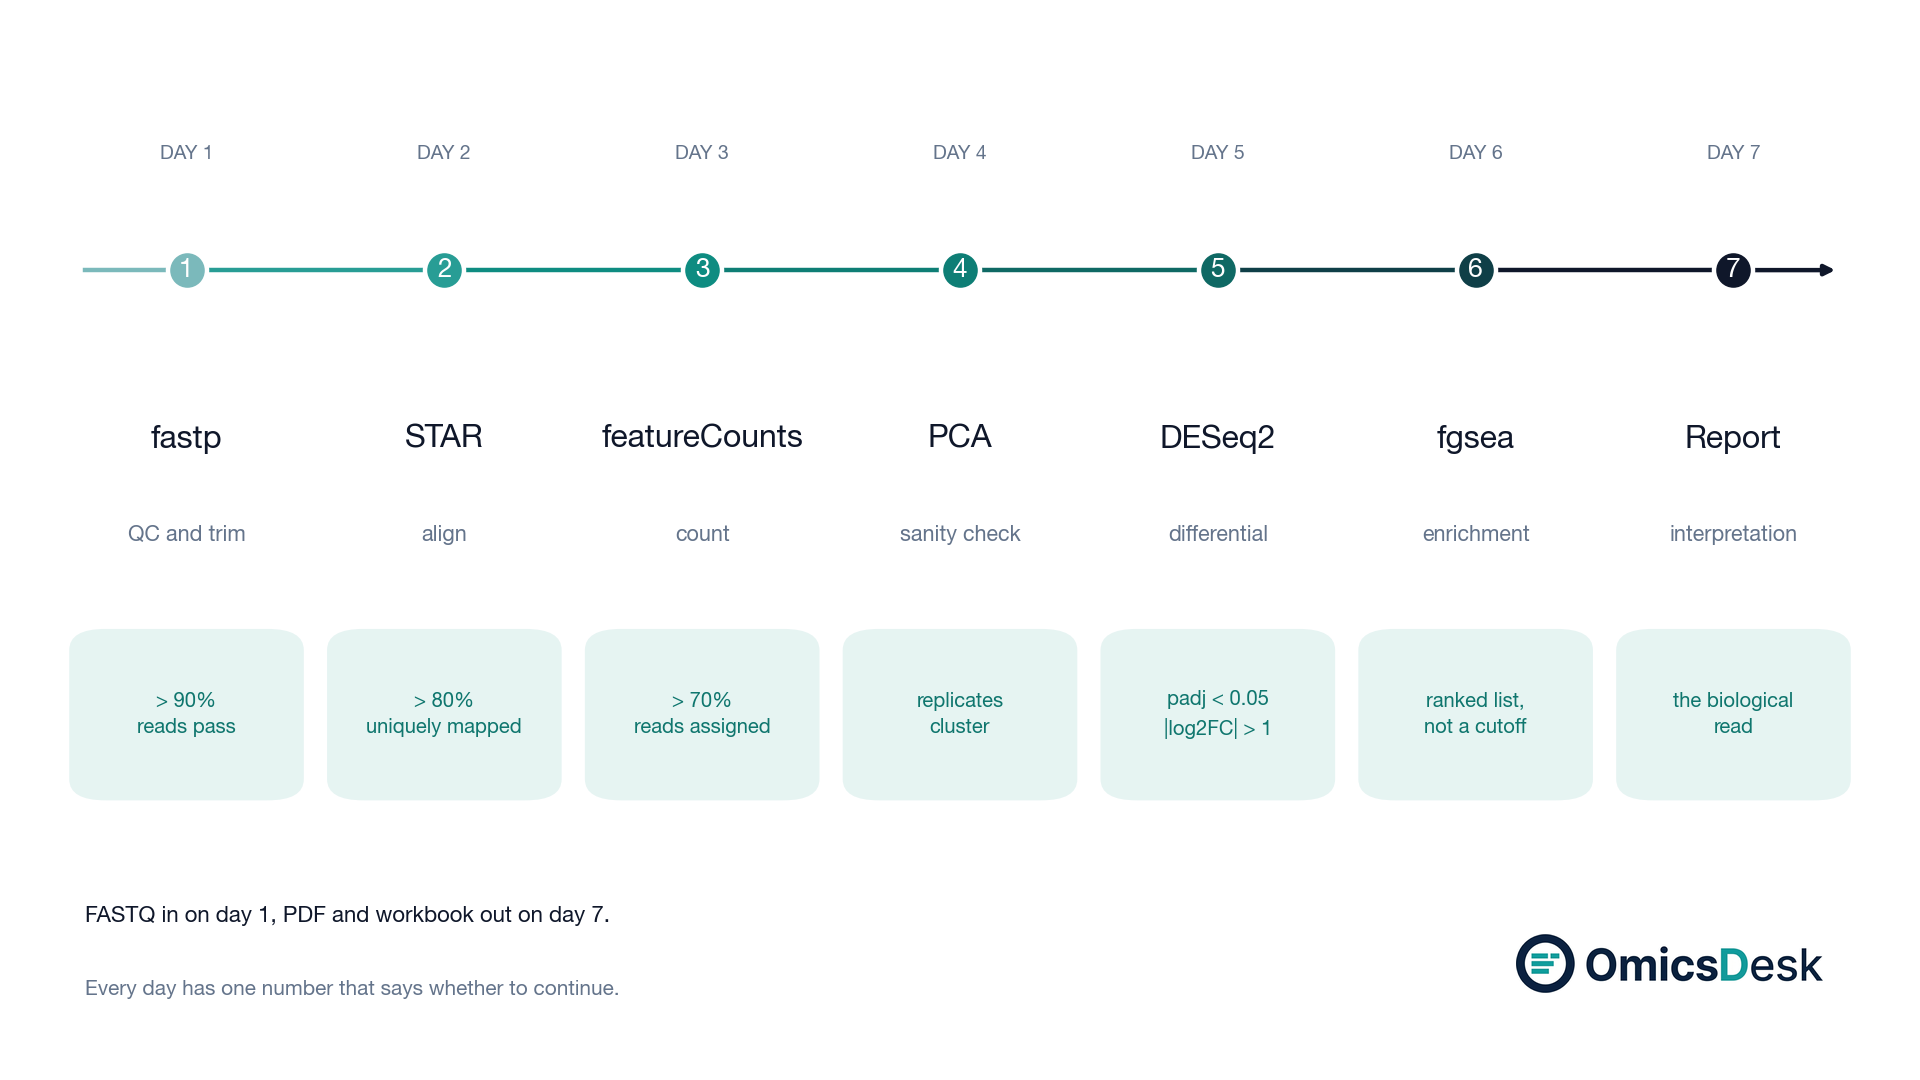
How long does RNA-seq analysis take? Seven days, and the gate that ends each one
Seven working days from FASTQ to interpreted report. What each day has to clear before the next one starts, what a failed gate costs if you find it late, and the three things that actually make a project slip.
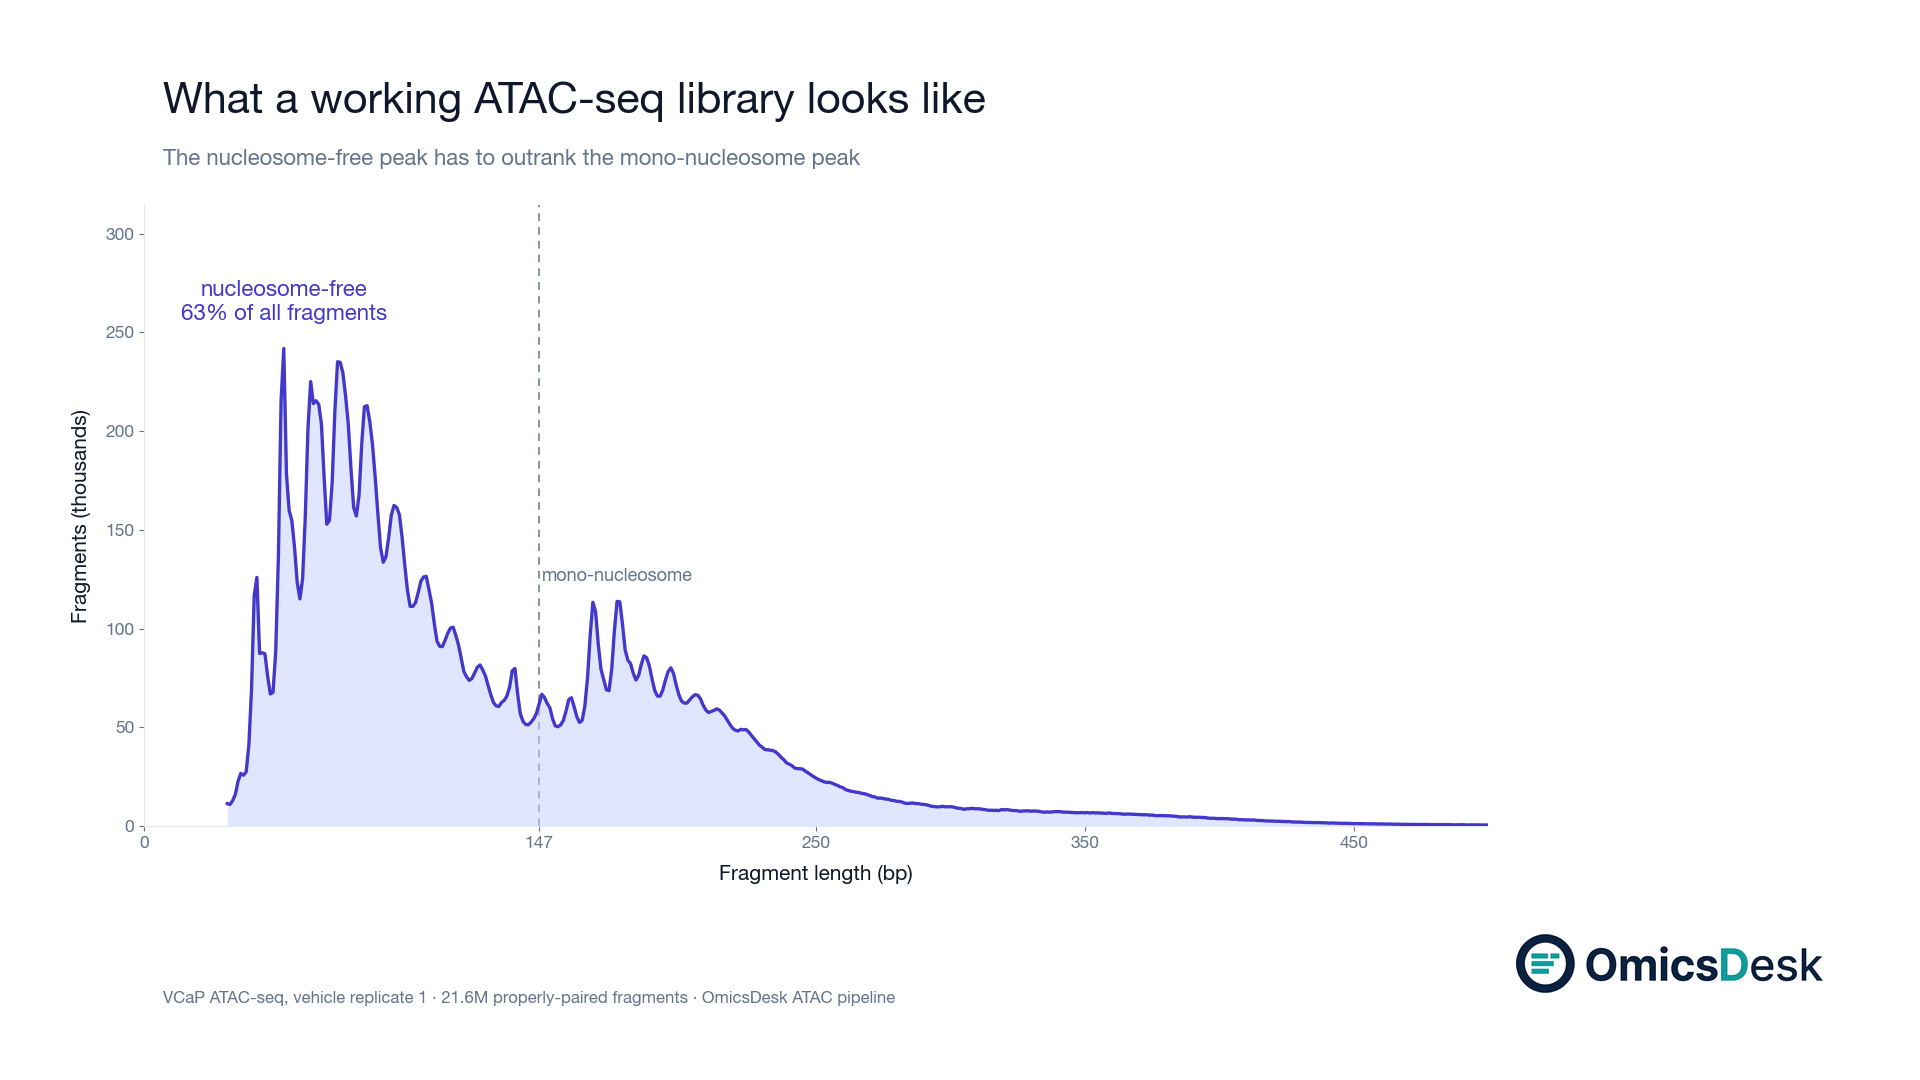
ATAC-seq Fragment Length Distribution: What the Nucleosome Ladder Is Telling You
How to read the ATAC-seq fragment length histogram, what a good library looks like, the three failure patterns, and what the NFR fraction actually measures.
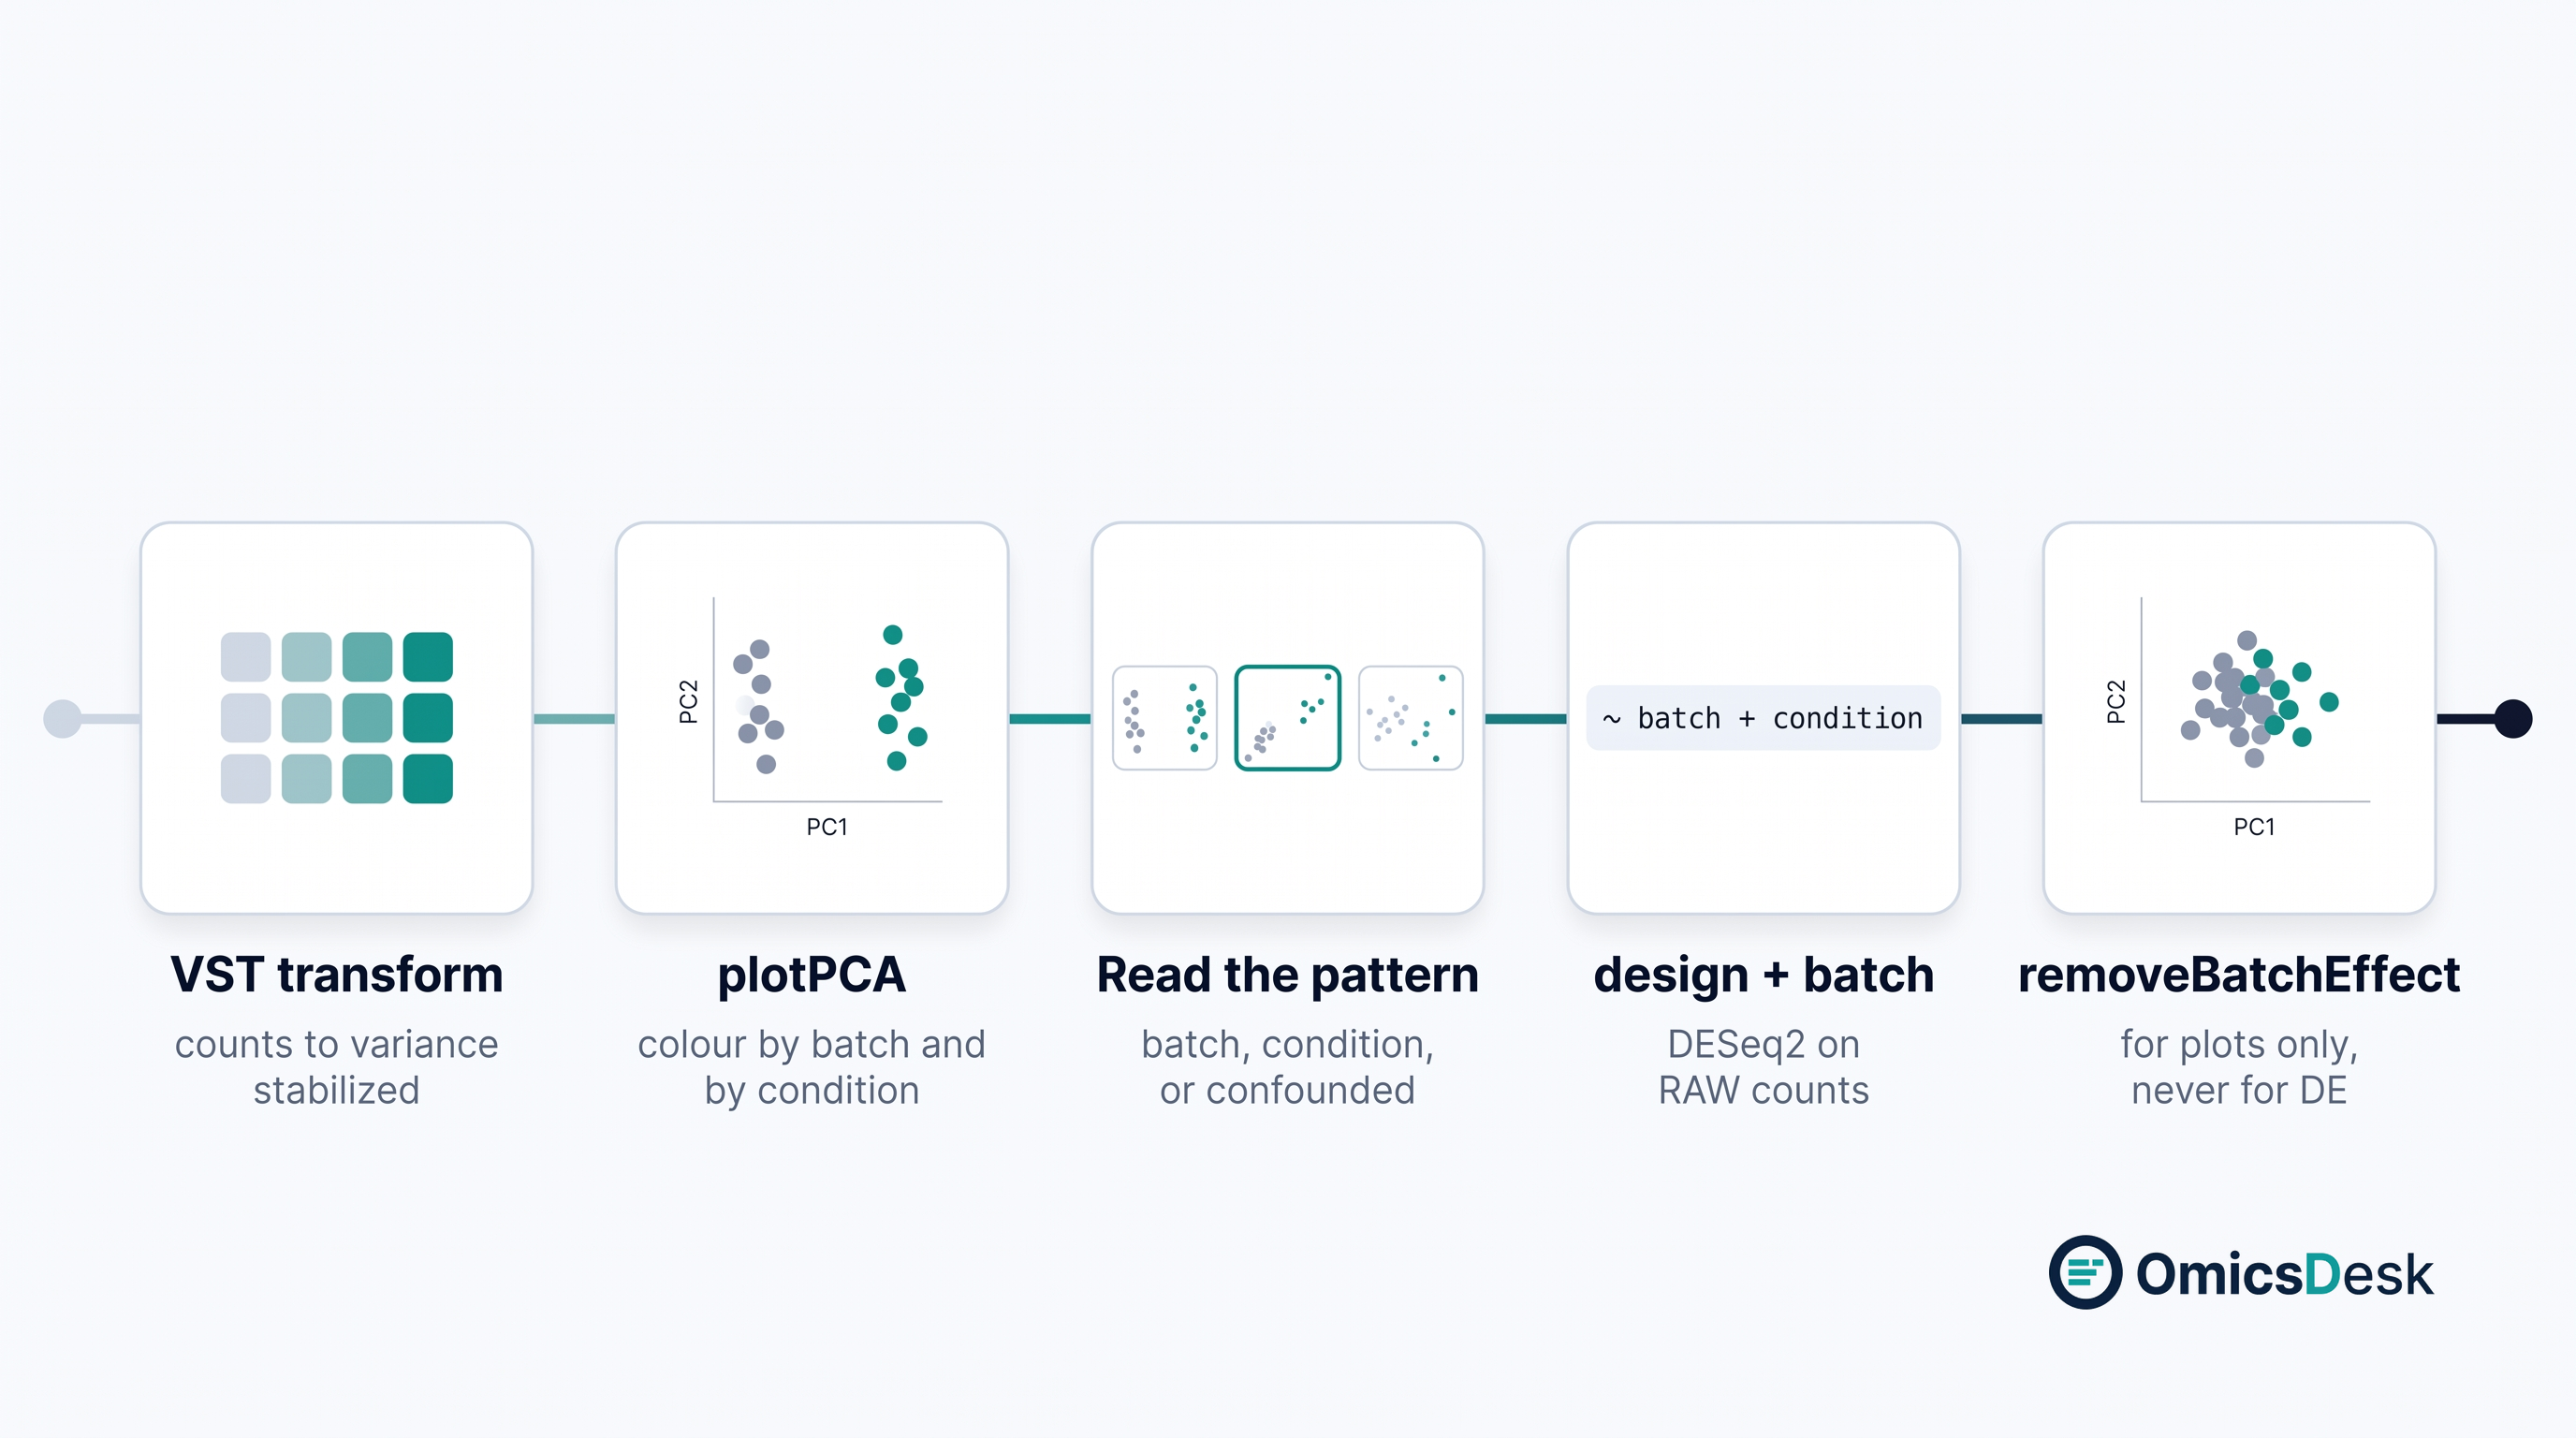
PCA for Batch Diagnosis: What the Plot Is Telling You and What to Do Next
A practical recipe for reading PCA plots to diagnose batch effects in RNA sequencing, with the right fix depending on your experimental design.
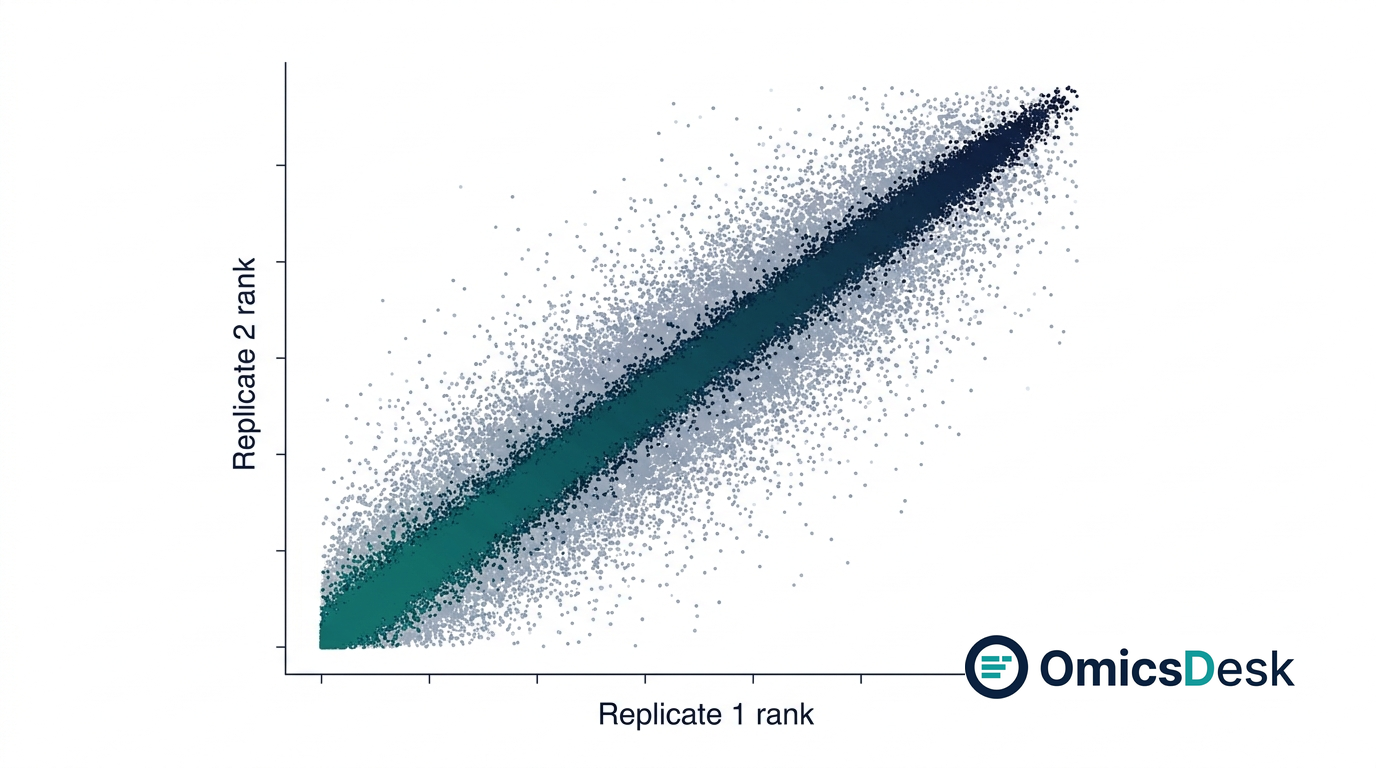
ChIP-seq IDR reproducibility explained
IDR (Irreproducibility Discovery Rate) tells you which ChIP-seq peaks are real across biological replicates. Here is how to run it, what input it needs, and how to read the output.
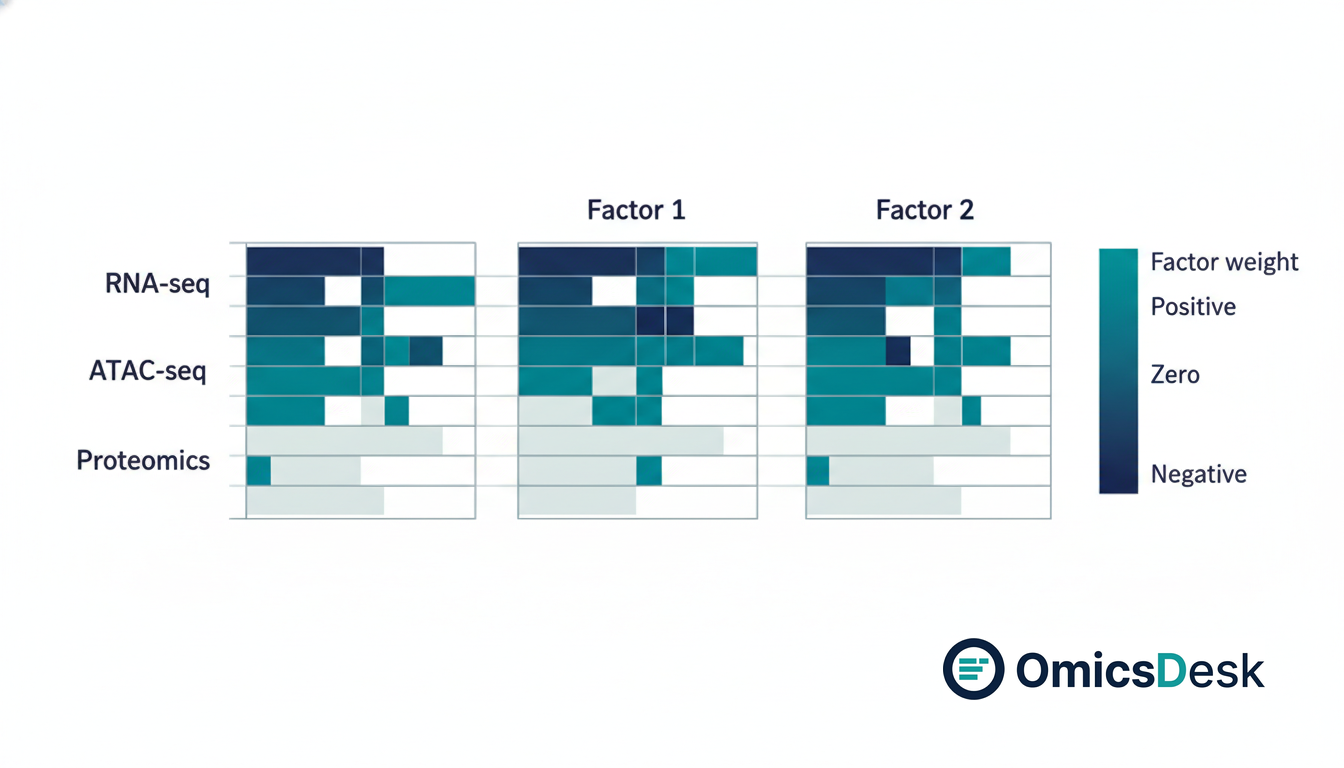
MOFA2 Explained: Integrating RNA-seq, Proteomics, and ATAC-seq in One Model
MOFA2 finds shared and modality-specific axes of variation across your omics layers. Here is how the model works, when to use it over DIABLO, and a minimal R walkthrough.
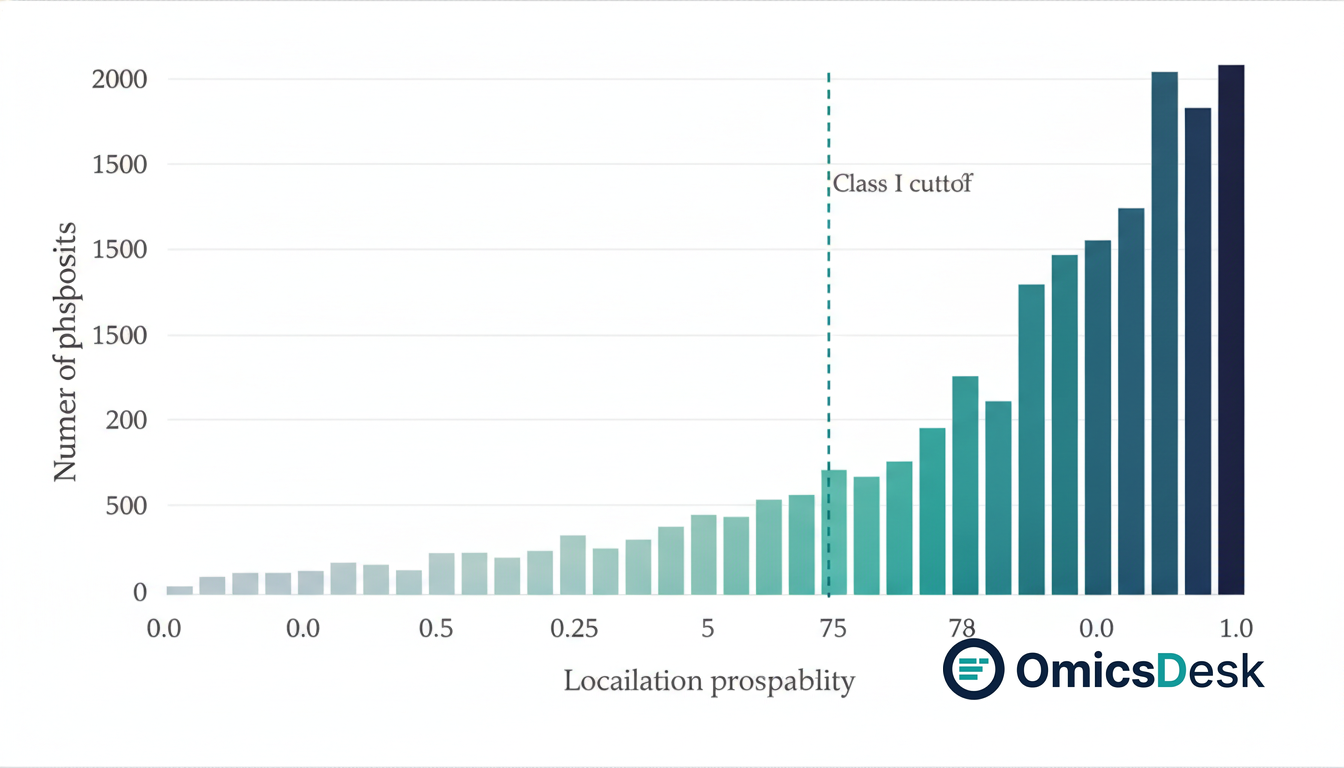
Class I phosphosites: the filter that changes everything in phosphoproteomics
Localization probability tells you whether the phospho group is assigned to the right residue. Filtering to Class I sites (LP > 0.75) before differential analysis is the single most important quality step in phosphoproteomics.
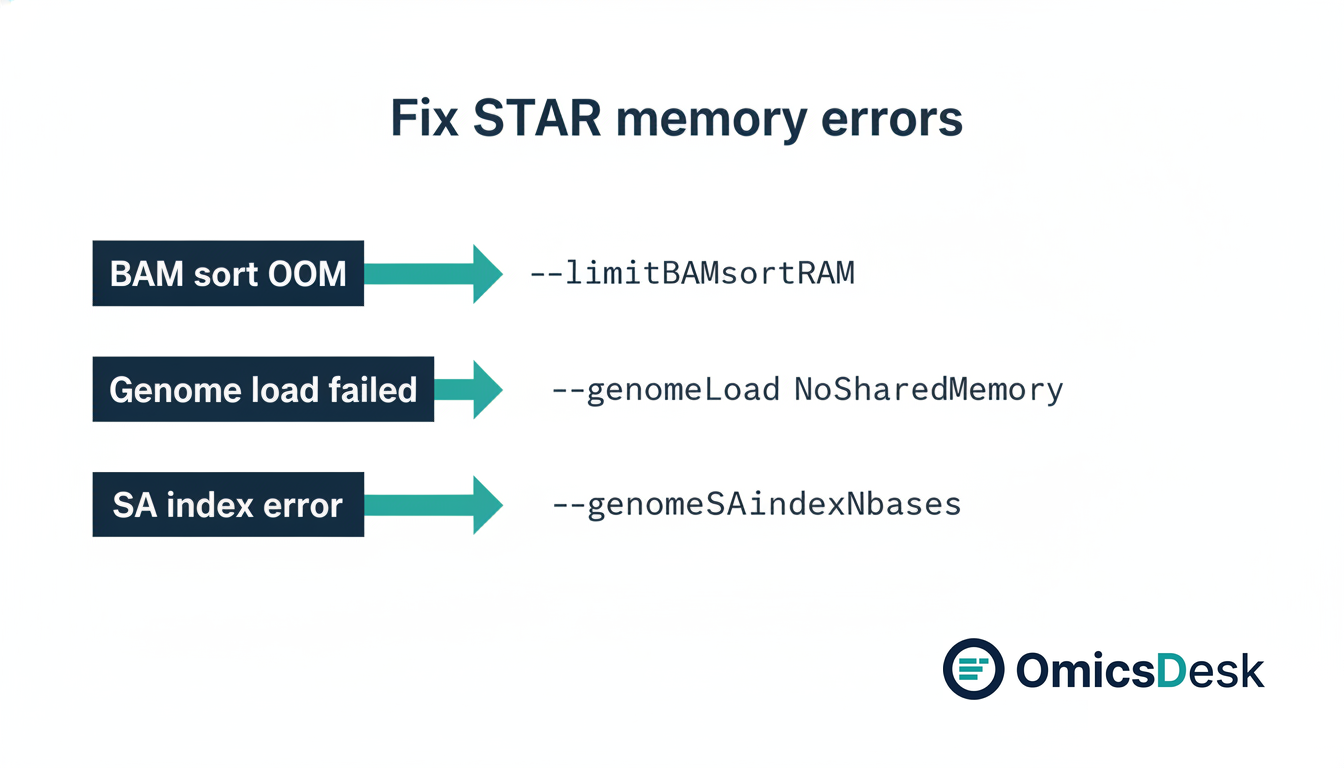
STAR alignment failed: the three memory errors and how to fix each one
STAR needs ~28 GB RAM for human hg38. When it fails with an OOM error, the cause is almost always one of three problems, each with a specific flag fix.
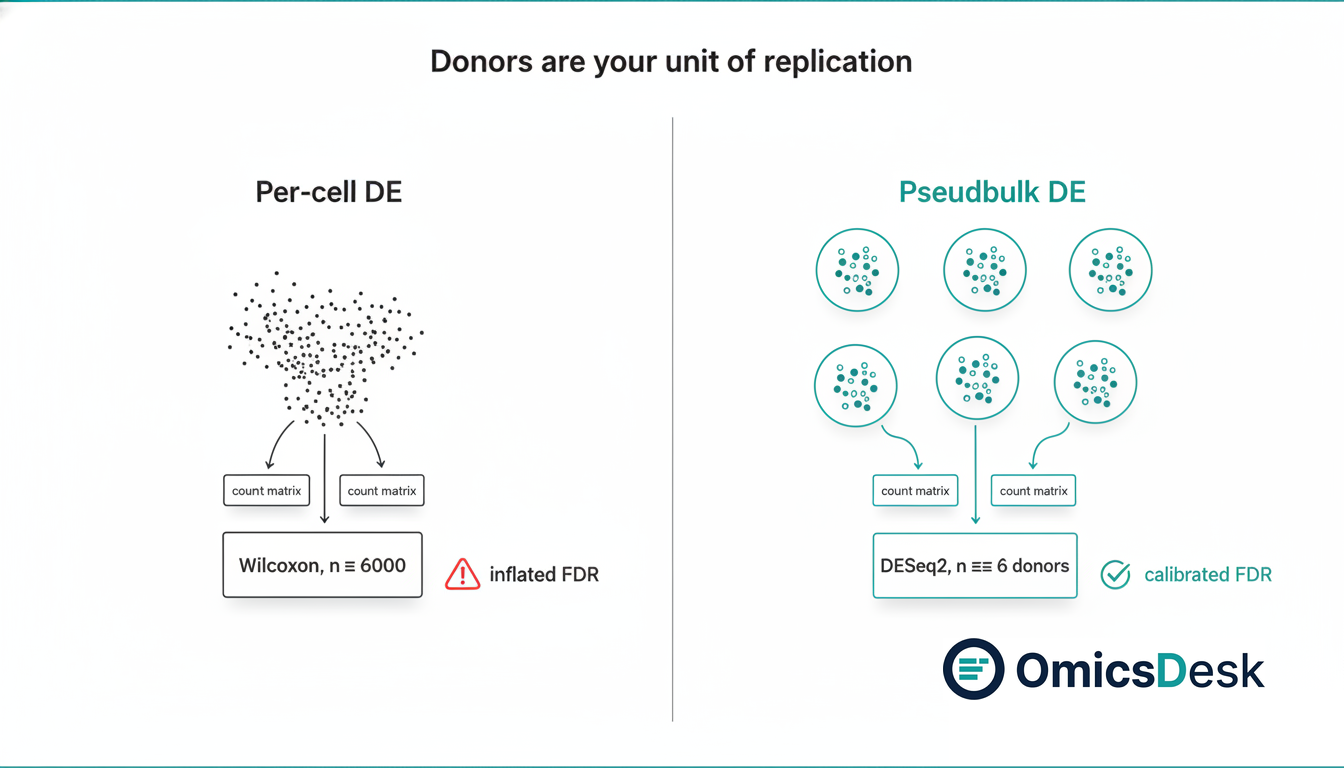
Pseudobulk DE in single-cell RNA-seq: why per-cell Wilcoxon gives you too many hits
Per-cell differential expression inflates your false discovery rate by treating cells as independent replicates. Pseudobulk aggregation fixes this. Here is how to run it and read the results.
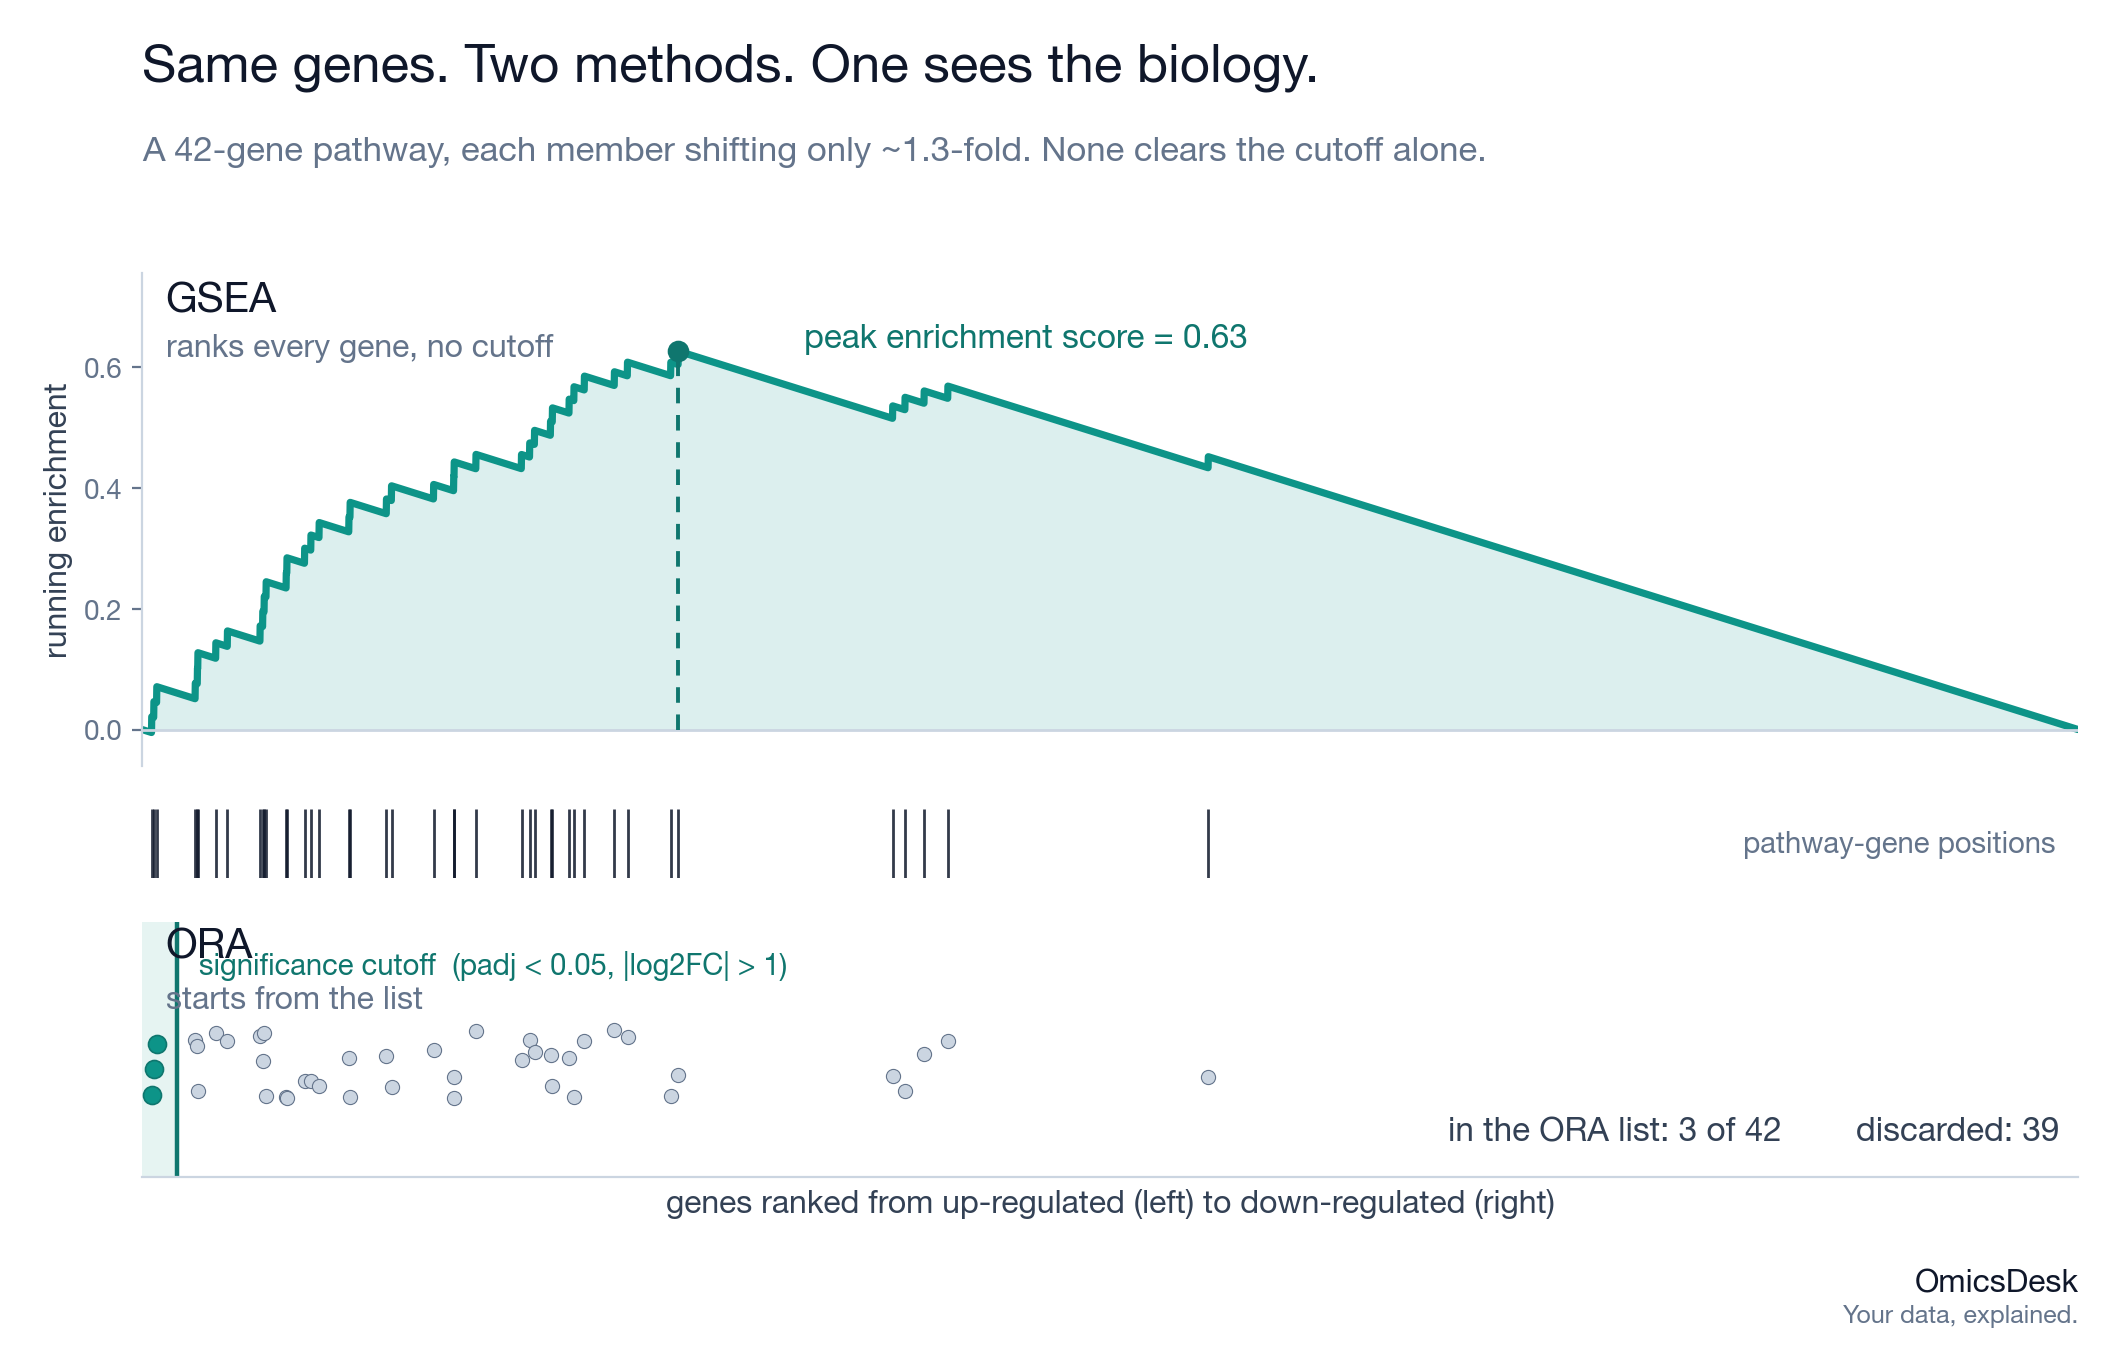
GSEA vs over-representation analysis in RNA-seq: why your DEG list misses pathways GSEA still finds
Over-representation analysis throws away every gene below your cutoff. GSEA ranks all of them. When that difference decides whether you see the biology, and the two settings that make or break the result.
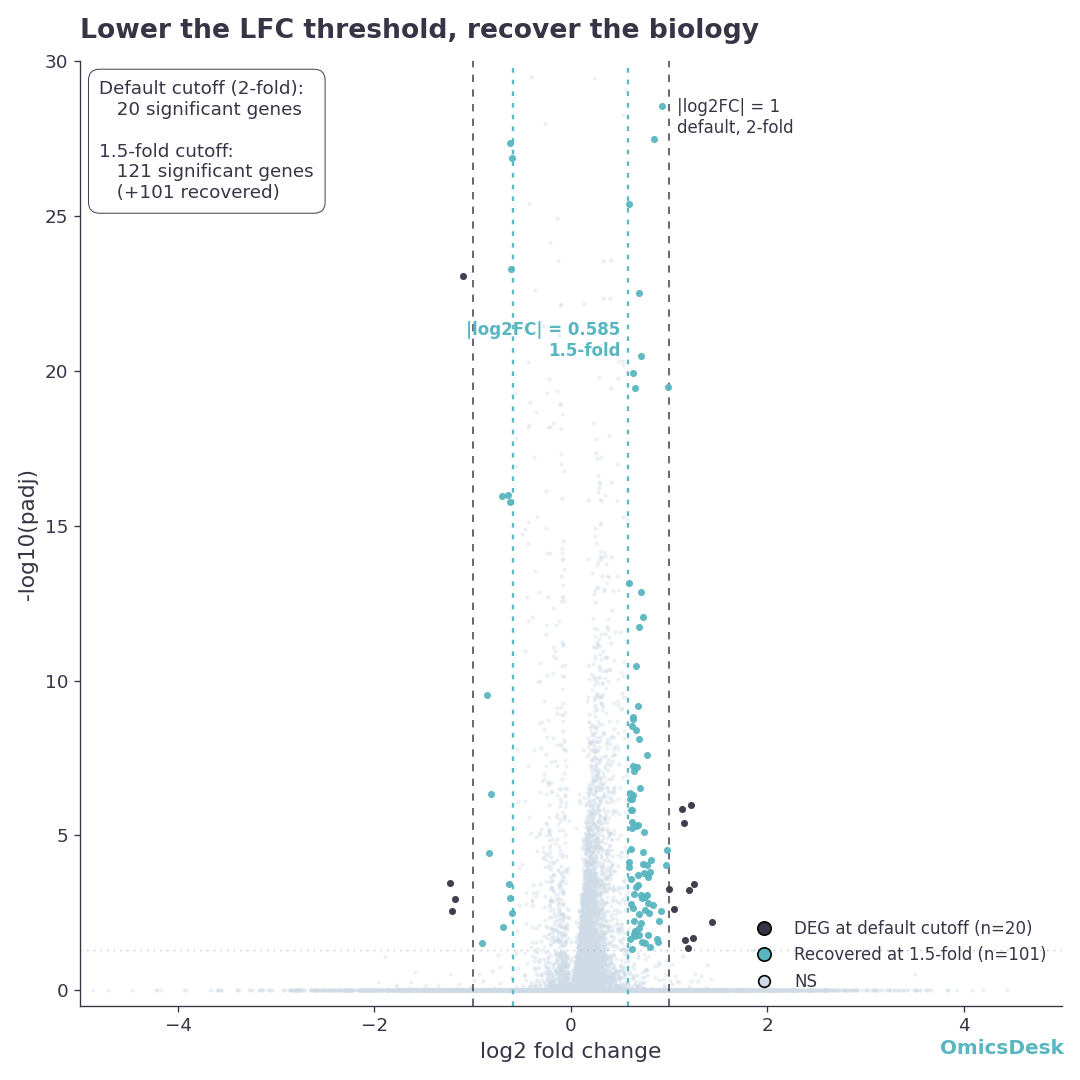
The DESeq2 log fold change threshold: when |log2FC| > 1 is the wrong ruler
The 2-fold cutoff is a cell-line habit that quietly discards real signal in clinical RNA-seq. When to lower it, why lfcShrink matters, and how to test against a threshold instead of filtering after the fact.
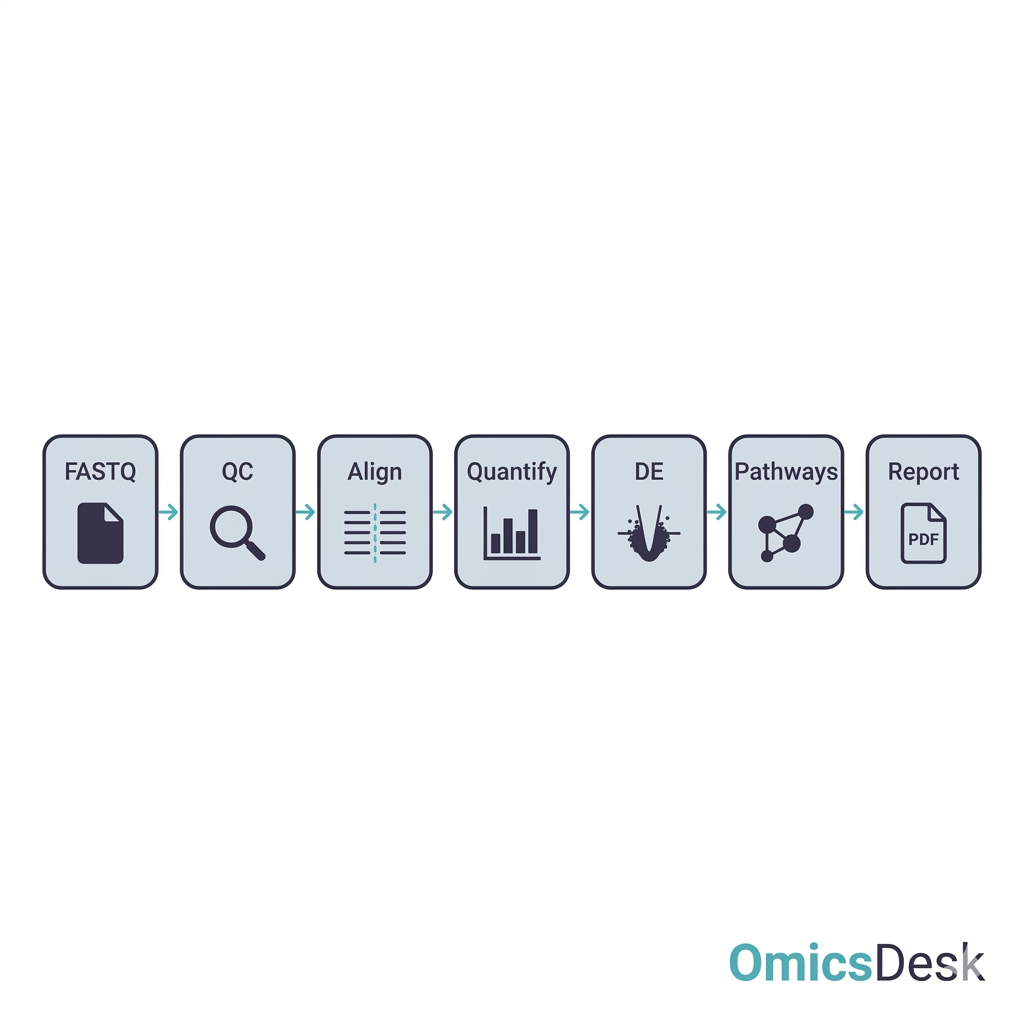
RNA-seq from FASTQ to DE: what a reproducible pipeline actually looks like in 2026
End-to-end RNA-seq workflow: QC, alignment, quantification, DESeq2, pathway analysis, reporting. The five stages, the real tool choices, and what production looks like in Snakemake.
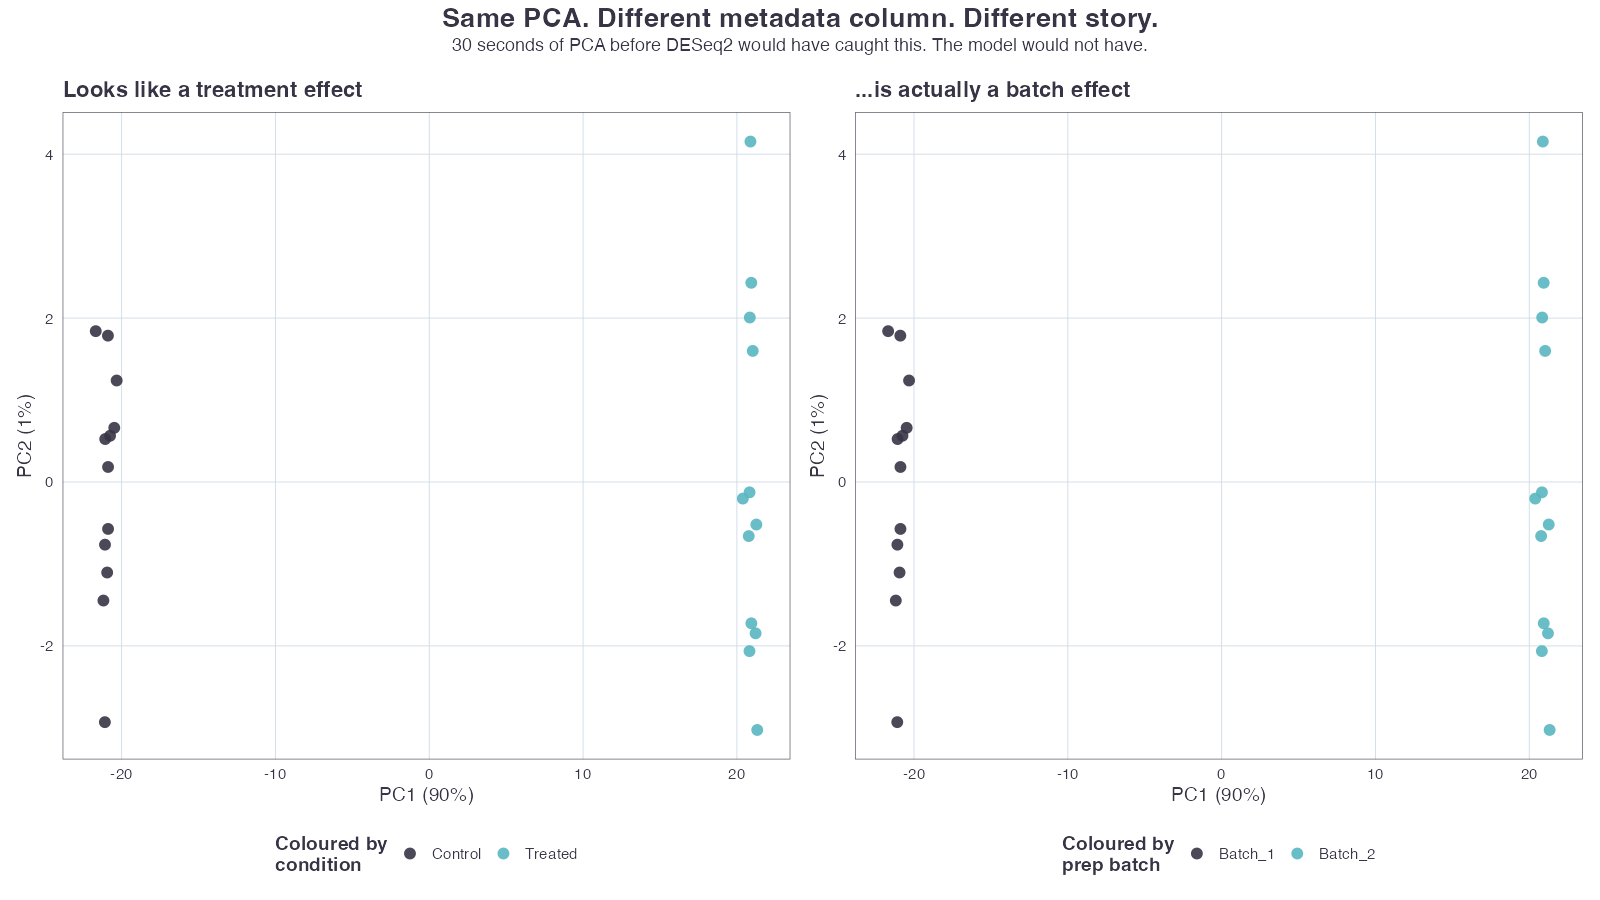
PCA before DESeq2: the 30-second sanity check that catches what DE misses
Running PCA before differential expression takes 30 seconds and catches batch effects, mislabeled samples, and outliers that silently destroy DESeq2 results. How to read it.
Tumor-only WGS variant calling without matched normal: what actually works in 2026
Why tumor-only somatic calling is harder than the docs admit, and a layered filter strategy that keeps false-positive rate manageable: PoN, gnomAD AF, and signature-based germline cleanup.