The DESeq2 log fold change threshold: when |log2FC| > 1 is the wrong ruler
The 2-fold cutoff is a cell-line habit that quietly discards real signal in clinical RNA-seq. When to lower it, why lfcShrink matters, and how to test against a threshold instead of filtering after the fact.
A 16-sample contrast comes back from DESeq2 with three significant genes. The wet-lab side asks what went wrong with the experiment. Nothing went wrong with the experiment. The threshold was the wrong ruler.
This post is about one line of most DESeq2 tutorials that gets copied without thought: the |log2FoldChange| > 1 filter, the so-called 2-fold cutoff. It is a sensible default in exactly one setting and a quiet signal-killer in several others. If you analyse RNA-seq from patient tissue, clinical cohorts, or any system you cannot perturb hard, this is worth ten minutes.
You will come away able to decide, for your own data, whether 2-fold is defensible, what to use instead, and why lfcShrink() changes the question entirely.
What the threshold actually is
A log2 fold change of 1 means a doubling. log2FC of 2 means a quadrupling. log2FC of 0.585 means a 1.5-fold change. The number is symmetric in log space, so log2FC of -1 is a halving.
When you write res <- results(dds); sig <- res[res$padj < 0.05 & abs(res$log2FoldChange) > 1, ], you are applying two independent filters. The first, padj < 0.05, is a statement about confidence: how sure are we the gene moved at all. The second, abs(log2FoldChange) > 1, is a statement about magnitude: did it move enough to care about. People conflate the two constantly, and that is where the trouble starts. A gene can be unambiguously, highly significantly changed and still sit at 1.6-fold. The 2-fold rule throws it out anyway.
Where the 2-fold cutoff comes from
The convention is borrowed from cell-line biology, and there it earns its keep. When you knock down a gene, overexpress a construct, or hit cells with a high dose of a drug, you are engineering a large, clean perturbation in a homogeneous population. Effect sizes are big because you made them big, replicates are tight because the cells are near-identical, and a 2-fold floor is a reasonable way to say “show me the genes that really moved, not the noise.”
Patient samples break every one of those assumptions. Human tissue is heterogeneous: mixed cell types, variable purity, genetic background, treatment history. The contrast is rarely a clean on/off switch; it is treated versus untreated in people who are already different from one another, or disease versus control across donors who vary in a dozen ways you did not measure. Real biological effects in that setting routinely land between 1.3-fold and 1.8-fold. They are no less real for being modest. They are modest because biology in an outbred, heterogeneous population is modest.
Keep the cell-line ruler and you measure clinical data against a standard it was never going to meet. The volcano comes back empty, and an experiment that worked looks like a failure.
The intuition, in one figure
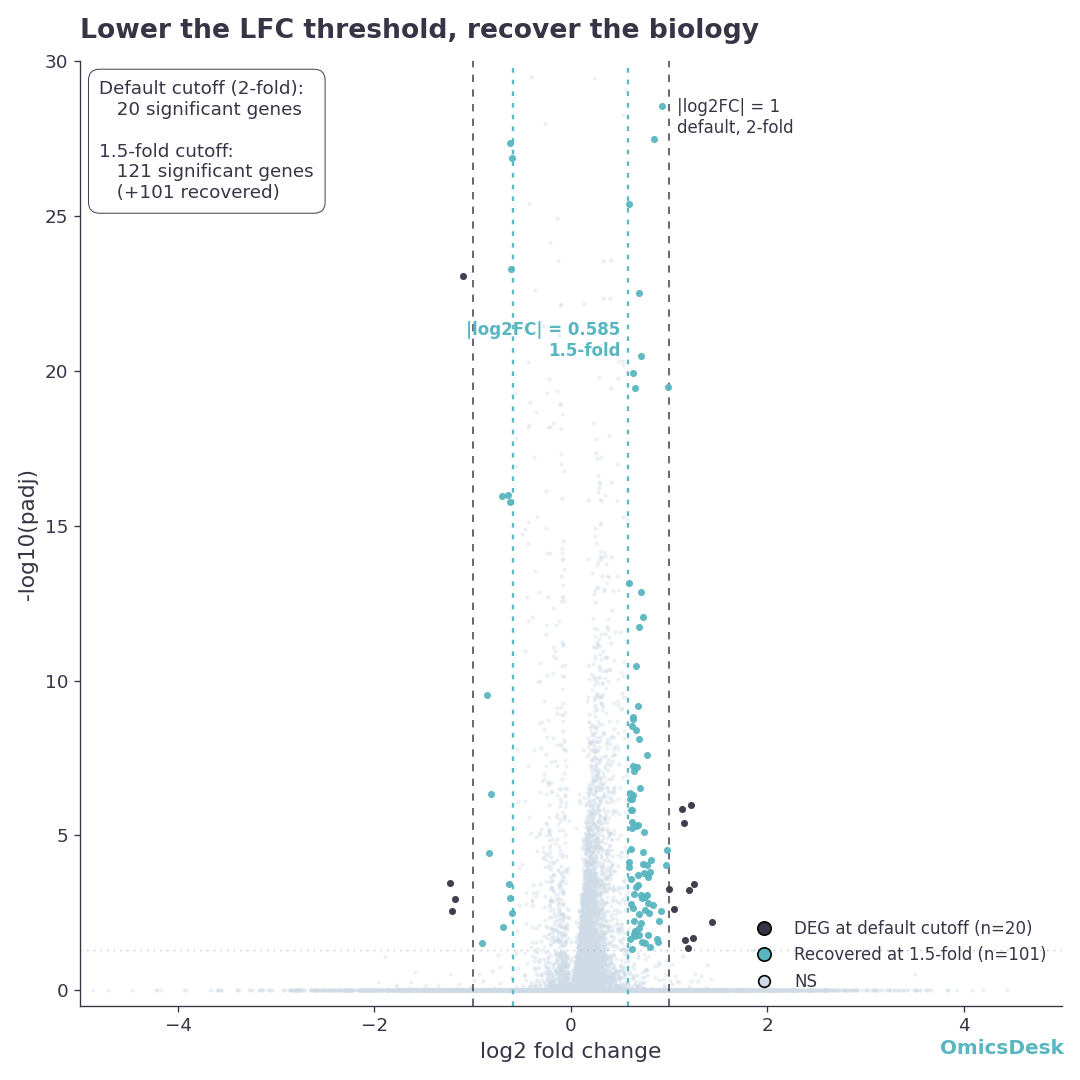
The hero figure above is a real contrast from our mouse-heart pressure-overload demo (TAC vs Sham), with two pairs of threshold lines drawn on it. The purple points are the 20 genes that survive the default 2-fold cutoff. The teal points are 101 more genes that survive once you drop to a 1.5-fold cutoff: 121 in total. Every one of those teal genes cleared the same padj < 0.05 bar as the purple ones. The only thing separating them is magnitude. The dashed purple lines at |log2FC| = 1 keep the purple points and discard every teal one. The dotted teal lines at |log2FC| = 0.585 keep both.
Twenty versus 121 is not a rounding error. It is the difference between a result that looks like a near-failure and one with enough genes to run a meaningful pathway analysis. If the teal band is empty in your data, your 2-fold cutoff costs you nothing and you should keep it. If it is full, as it is here, the cutoff is the single most consequential decision in your analysis, and it is being made by a number you copied from a tutorial.
So the first move is never to argue about the threshold in the abstract. It is to plot the volcano and look at where the significant genes actually are.
When 2-fold is right, and when it is not
Use |log2FC| > 1 when:
- You are working with cell lines or other engineered, homogeneous systems with strong perturbations.
- You have a long list of significant genes and you are deliberately prioritising the largest effects for follow-up, fully aware you are trading sensitivity for a shorter list.
- A downstream constraint genuinely requires large effects, for example picking a handful of candidates for qPCR validation.
Lower the threshold, or drop it entirely and rank by significance, when:
- The samples are patient or clinical material, primary tissue, or any heterogeneous population.
- The contrast is subtle by nature: time points close together, a low drug dose, an early disease stage.
- The biology you care about is regulatory. Transcription factors and signalling genes often exert large downstream effects through small changes in their own expression.
- You plan to feed the result into pathway or GSEA analysis, which uses the whole ranked list and does not want a hard magnitude filter upstream.
There is no universal correct number. There is a correct number for your design, and you find it by looking at the data, not by defaulting.
The better move: test against a threshold, do not filter after the fact
Here is the part most tutorials skip. Filtering on abs(log2FoldChange) > 1 after the fact is statistically crude. You ran a test whose null hypothesis was “fold change equals zero”, got your p-values, and then quietly imposed a magnitude rule the test never knew about. The p-values do not account for it.
DESeq2 can fold the magnitude into the hypothesis itself:
# Test the null "the effect is no larger than 1.5-fold", not "no change at all"
res <- results(dds,
               lfcThreshold = 0.585,   # log2(1.5)
               altHypothesis = "greaterAbs")

summary(res)
Now padj answers the question you actually care about: is this gene’s effect significantly larger than 1.5-fold. Genes that merely wobble above 1.5-fold by chance are penalised correctly, and the result is honest in a way a post-hoc filter never is. Choose the lfcThreshold to match the smallest effect that is biologically meaningful in your system, then let the statistics respect it.
lfcShrink: the fold changes you filter on are noisy
There is a deeper problem hiding underneath the threshold question. The raw log2FoldChange for a low-count or high-variance gene is wildly unreliable. A gene with a handful of reads can show a 5-fold change that is pure sampling noise. If you filter on raw LFC, those noisy extremes sail through your magnitude cutoff while genuine, well-measured 1.6-fold effects get cut.
This is exactly what shrinkage fixes:
library(apeglm)
res_shrunk <- lfcShrink(dds, coef = "condition_treated_vs_untreated", type = "apeglm")
lfcShrink() pulls unreliable fold changes toward zero in proportion to how noisy they are, while leaving well-estimated ones essentially untouched. After shrinkage, the LFC values mean something consistent across genes, and a magnitude threshold applied to them is defensible. The modern recommendation is simple: report shrunken LFCs, rank and visualise on them, and never threshold on raw LFCs from low-count genes. Use apeglm for standard coefficient contrasts; ashr when you need to shrink an arbitrary contrast that apeglm does not support.
Note the division of labour. lfcThreshold in results() controls the hypothesis test and the p-values. lfcShrink() controls the effect-size estimates you plot and filter. They solve different halves of the same problem, and a careful analysis uses both.
How to read and report it
When you hand a result to a collaborator or a client, make the threshold a visible, reversible decision rather than a buried default:
- Show the volcano with both threshold lines, as in the figure above. Let the reader see how many genes sit in the band between 1.5-fold and 2-fold.
- State the contrast, the
padjcutoff, and whether the LFC is raw or shrunken, in one sentence near the table. - If you tested against a non-zero
lfcThreshold, say so explicitly. “Significantly above 1.5-fold at FDR < 0.05” is a different and stronger claim than “FDR < 0.05 and happens to exceed 1.5-fold.” - Put the full ranked list in the supplementary workbook. The threshold decides what goes in the headline figure, not what exists.
Common ways this goes wrong
- Copying
> 1from a cell-line tutorial onto patient data. The single most frequent cause of a “failed” clinical RNA-seq experiment that did not actually fail. - Filtering on raw LFC instead of shrunken LFC. Lets noisy low-count genes through and cuts well-measured modest effects. Backwards from what you want.
- Applying a hard LFC filter before GSEA. GSEA wants the full ranked list. A magnitude pre-filter destroys the signal it is built to detect.
- Treating padj and the LFC threshold as one decision. They answer different questions. Significance is confidence; fold change is magnitude. Report both, conflate neither.
- Lowering the threshold only after the volcano comes back empty. Decide the meaningful effect size from the biology before you see the result, so the choice is principled rather than a rescue.
Further reading
- Love, Huber, Anders (2014), Moderated estimation of fold change and dispersion for RNA-seq data with DESeq2, Genome Biology. The original method paper.
- Zhu, Ibrahim, Love (2019), Heavy-tailed prior distributions for sequence count data (apeglm), Bioinformatics. The shrinkage estimator you should default to.
- The DESeq2 vignette section on
lfcThresholdandaltHypothesis, and onlfcShrink. The canonical, current reference for both.
When you would rather not make this call yourself
Every RNA-seq report we ship through OmicsDesk shows the volcano at both the conventional 2-fold cutoff and the 1.5-fold equivalent, side by side, with shrunken fold changes and the threshold chosen to fit the biology rather than the convention. If you have FASTQs or a count matrix and you want the differential expression done with the thresholds defended rather than defaulted, upload them at omicsdesk.com. The intake agent confirms the analysis plan with you before anything runs, and the turnaround is fixed at 7 to 10 business days.