Pseudobulk DE in single-cell RNA-seq: why per-cell Wilcoxon gives you too many hits
Per-cell differential expression inflates your false discovery rate by treating cells as independent replicates. Pseudobulk aggregation fixes this. Here is how to run it and read the results.
You annotated your clusters, assigned cell types, and now you want to know: which genes are
differentially expressed between your two conditions? The obvious next step in a Seurat workflow
is FindMarkers. It runs on cells. It is also statistically wrong for this question, and the
error compounds with dataset size.
This post explains why, what pseudobulk aggregation is, and how to run it correctly with pydeseq2 or edgeR. Once you are in DESeq2 territory, the same rules apply as in bulk: run PCA on the aggregated samples first, and think before setting a log2 fold change threshold.
The tempting shortcut: per-cell Wilcoxon
Seurat’s FindMarkers and the equivalent functions in scanpy run a Wilcoxon rank-sum test (or
similar) across all cells of a given type, comparing condition A cells to condition B cells. If
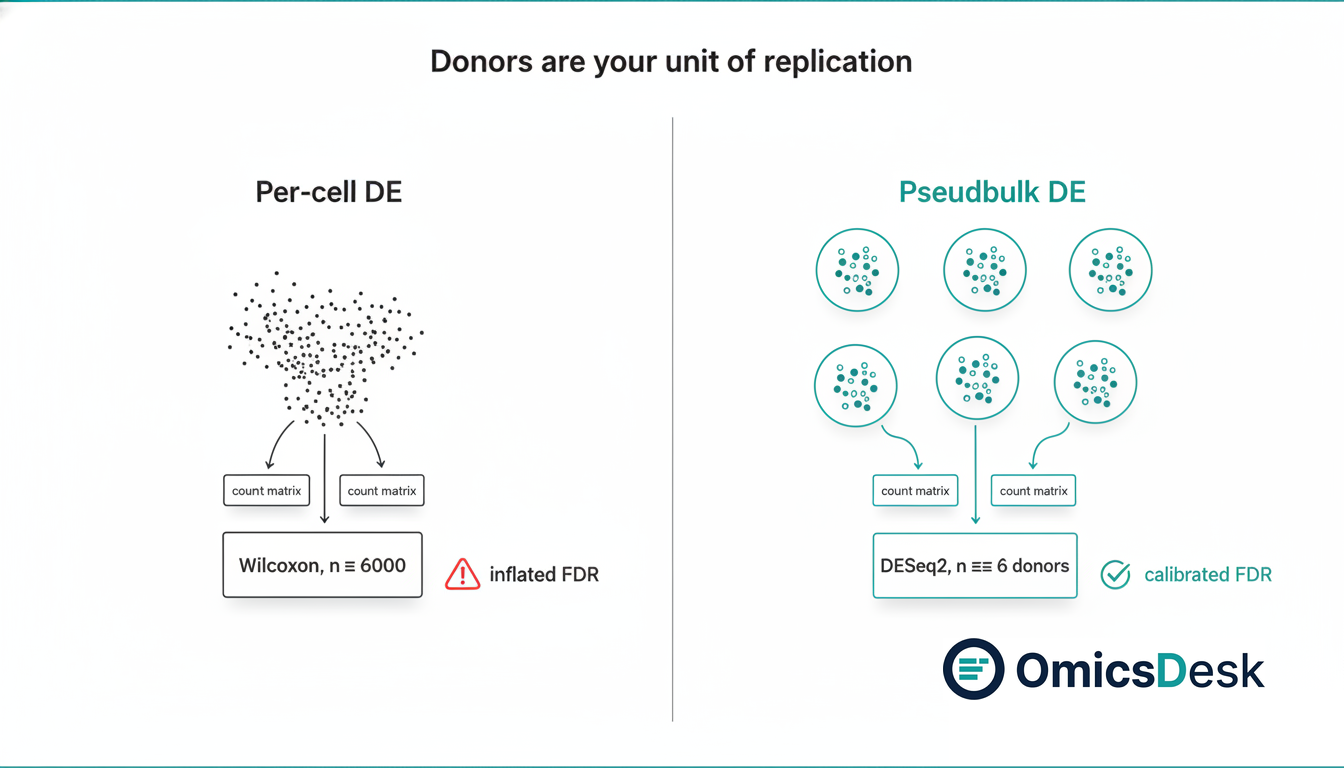
you have 3,000 T cells from 3 treated donors and 3,000 T cells from 3 control donors, the test
sees n = 6,000.
The problem is that those 3,000 T cells per condition are not 3,000 independent observations. They came from 3 donors. The biological replication is 3, not 3,000. Treating cells as independent inflates statistical power artificially, and the result is a list of differentially expressed genes with a false discovery rate far higher than the reported 5%.
How much higher? Squair et al. (Nature Methods, 2021) benchmarked 14 single-cell DE methods on datasets with known ground truth. Per-cell methods produced up to 10-fold FDR inflation compared to pseudobulk methods. At padj < 0.05, a per-cell Wilcoxon might return 500 genes where only 50 are real.
What pseudobulk means
Pseudobulk aggregation is simple: for each cell type and each donor, sum (or average) the raw counts across all cells of that type from that donor. You get one count vector per donor per cell type.
If you have 6 donors across 2 conditions, you now have 6 pseudobulk samples per cell type. Then you run a standard bulk DE method on those 6 samples, treating donors as your unit of replication.
The biological reality: your donors are the independent units. Your cells are technical replicates within each donor. Pseudobulk honors that structure.
How to run it
Two practical paths exist depending on your environment.
Python (pydeseq2, inside a scanpy workflow):
import pandas as pd
from pydeseq2.dds import DeseqDataSet
from pydeseq2.ds import DeseqStats

# adata is your AnnData, subset to one cell type
# "donor" and "condition" are obs columns

counts = (
    adata.obs.groupby(["donor", "condition"])
    .apply(lambda g: adata[g.index].X.toarray().sum(axis=0))
    .apply(pd.Series)
)
counts.columns = adata.var_names
counts = counts.astype(int)

metadata = counts.index.to_frame(index=False)

dds = DeseqDataSet(
    counts=counts,
    metadata=metadata,
    design_factors="condition",
)
dds.deseq2()

stat_res = DeseqStats(dds, contrast=("condition", "treated", "control"))
stat_res.summary()
results = stat_res.results_df
R (edgeR pseudoBulkDGE):
library(edgeR)

# pb is a SummarizedExperiment from muscat::aggregateData
# one assay per cell type, donors as columns

pb_celltype <- pb[["T_cells"]]
dge <- DGEList(counts = assay(pb_celltype), group = colData(pb_celltype)$condition)
dge <- calcNormFactors(dge)
design <- model.matrix(~ condition, data = colData(pb_celltype))
dge <- estimateDisp(dge, design)
fit <- glmQLFit(dge, design)
res <- glmQLFTest(fit, coef = 2)
topTags(res)
One practical note: filter out donors with fewer than 10 cells for a given cell type before aggregating. A pseudobulk sample built from 2 cells is noise, not signal.
How to read the output
The output of a pseudobulk analysis looks identical to a bulk DESeq2 result: log2FoldChange, pvalue, padj, baseMean. Apply the same thresholds: absolute log2FC greater than 1 and padj less than 0.05 as the standard operating filter.
The number of hits will almost certainly be smaller than a per-cell analysis of the same data. That is correct. You have n = donors, not n = cells. If your n is 3 donors per group, you have limited power to detect modest fold changes, and that limitation is real biology and study design, not a bug in the method.
Common misuses
Three failure modes appear often in practice.
Mixing cell types. Running pseudobulk on all cells pooled together, not per cell type, defeats the purpose. DE effects are cell-type-specific. Pool T cells with B cells and fibroblasts, and you average away the signal.
Skipping the minimum-cell filter. A pseudobulk sample with 2 or 3 cells is dominated by sampling noise. The standard practice is to require at least 10 cells per donor per cell type and to drop donors that fall below this threshold for a given cell type.
Reporting per-cell Wilcoxon p-values as confirmation. Per-cell results are sometimes used as a secondary validation pass, but their p-values are not calibrated. Use them only for ordering genes within a cluster for annotation, not for cross-condition DE.
Further reading
Squair et al. (2021) is the essential benchmark: Nature Methods 18, 1367 to 1375. Crowell et al. (2020) introduced the muscat R package and a clear framework for pseudobulk in multi-sample scRNA-seq: Nature Communications 11, 6077. The pydeseq2 documentation covers the Python path in detail. The edgeR pseudoBulkDGE vignette covers the R path with a worked example from the muscat authors.
DM me if you want to talk through the experimental design or statistical model for your dataset. That conversation is free, and it usually saves a lot of downstream confusion.
Full analysis: omicsdesk.com
Keep reading
- 2026-05-29 The DESeq2 log fold change threshold: when |log2FC| > 1 is the wrong ruler The 2-fold cutoff is a cell-line habit that quietly discards real signal in clinical RNA-seq. When to lower it, why lfcS…
- 2026-08-14 How long does RNA-seq analysis take? Seven days, and the gate that ends each one Seven working days from FASTQ to interpreted report. What each day has to clear before the next one starts, what a faile…
- 2026-07-31 PCA for Batch Diagnosis: What the Plot Is Telling You and What to Do Next A practical recipe for reading PCA plots to diagnose batch effects in RNA sequencing, with the right fix depending on yo…